

Introduction
Materials and Methods
Plant Materials and Growth Conditions
Measurement of Petiole Length, Leaf Area, Leaf Biomass, and Shoot Biomass
Determination of Photosynthetic Pigment Content
Measurement of Chl Fluorescence Transients
Measurement of Fruit Weight
Measurement of Sugar Content in Strawberry Fruit
Determination of Soluble Protein Content in Strawberry Fruit
Measurement of Anthocyanin Content in Strawberry Fruit
Calculations and Statistical Analyses
Results
Growth Status of Strawberry Plants under Different Colored Light-Quality Selective Plastic Films
Photosynthetic Pigments under Different Colored Light-Quality Selective Plastic Films
Chl Fluorescence Parameters under Different Colored Light-Quality Selective Plastic Films
Fruit Qualities under Different Colored Light-Quality Selective Plastic Films
Discussion
Introduction
Light quality refers to the color or wavelength reaching to the surface of plants (Johkan et al., 2010), which can strongly regulate and optimize plant growth and development, such as seed germination, photomorphogenesis, flowering, and photosynthesis (Moe et al., 2006; Massa et al., 2008; Yeh et al., 2009; Arena et al., 2016; Park et al., 2016). In addition, light quality can also influence organic compound accumulation and flavonoid metabolism in fruits, thereby affecting fruit quality (Gupta and Jatothu, 2013; Cheng et al., 2015).
Photosynthesis is the most basic energy conversion process in plants. Light quality affects many aspects during this process, such as photosynthetic pigment synthesis, stomatal opening, photosynthetic product accumulation, etc. (Li et al., 2013; Choi et al., 2015; Li et al., 2017a). Blue (B) light plays an important role in the development of chloroplasts and the formation of chlorophylls (Chls) that are involved in the absorption, transmission, and transformation of light energy during photosynthetic processes (Senger, 1982; Eskins et al., 1991; Zheng et al., 2008). Compared to B light, red (R) light showed stronger effects on the synthesis of Chls and carotenoids (Cx+c), while green (G) light inhibited their synthesis (Choi et al., 2015). Furthermore, some studies reported that R-B mixed light was even more beneficial to photosynthetic pigment formation compared to monochromatic light (Li et al., 2013; Choi et al., 2015).
Stomata are the main portals for the exchange of gas and water vapor in plants; thereby, stomatal movements have great impacts on the photosynthetic abilities and accumulation of photosynthetic products (Li et al., 2017b). Stomatal opening is regulated by the photoreceptors in guard cells, including the B light (phototropins and cryptochromes) and R/far-R light (phytochromes) photoreceptors (Stone et al., 2005; Chaves et al., 2011). Cryptochromes sense B light to promote stomatal opening and improve quantum efficiency (Kinoshita et al., 2001). However, the stomata in cucumber (Cucumis sativus) leaves were unresponsive to R light (Trouwborst et al., 2016), but biomass accumulated to the largest extent under R light (Cao et al., 2012). Li et al. (2013) found that stomatal length and frequency on the adaxial surface as well as the sucrose and soluble sugar content in rape (Brassica napus) leaves reached the maximum under R-B mixed light. In addition, purple (P) light decreased the photosynthetic rate in tomato (Solanum lycopersicum) leaves, with a reduction in the accumulation of photosynthetic products (Li et al., 2017a).
Light quality can substantially affect the growth and development of plants (Fan et al., 2013; Ramírez-Mosqueda et al., 2017). Under R, B, and P monochromatic light, tomato seedling growth was promoted by R light, but suppressed by B and P light (Li et al., 2017a), which may relate to their effect on auxin levels (Islam et al., 2014). However, supplemental B light promoted stem and internode elongation of cut chrysanthemum (Chrysanthemum sp.), and induced the flowering response stronger than day length (Jeong et al., 2014), indicating that light quality can regulate plant flowering (Hisamatsu et al., 2008; Fankhauser and Ulm, 2011).
Light quality also affects fruit quality by influencing the accumulation of organic compounds (Samuolienė et al., 2012). In tomato fruit, R, B, and R-B mixed light increased the content of fructose and glucose by improving the activities of sucrose synthase, acid invertase, and neutral invertase, while P light decreased these activities (Li et al., 2017a). In strawberry (Fragaria × ananassa) fruit, B light can improve the antioxidant systems, free radical-scavenging components, titratable acidity, and total phenolic content (Xu et al., 2014; Fu et al., 2017). Meanwhile, the accumulation of total anthocyanin and the individual anthocyanin pelargonidin 3-malonylglucoside improved under R film, while G, B, and white films decreased the total anthocyanin content (Miao et al., 2016).
The studies about light quality affecting plant growth, photosynthesis, and fruit quality mainly focused on R and B light, which were supplied with light-emitting diodes (LED) (Li et al., 2013; Trouwborst et al., 2016; Fu et al., 2017; Li et al., 2017b). However, light-quality selective plastic films are more suitable than LED systems in field production due to the high cost and inconvenience of LED systems (Miao et al., 2016). Strawberry fruit crops are produced mainly via facility cultivation. To determine the optimal light-quality selective plastic film for the production of high-quality strawberry fruit, we selected a popular cultivar “Akihime” as the material to investigate plant growth, photosynthetic abilities, and fruit qualities under 6 different colored films, including transparent (T), R, yellow (Y), G, B, and P films, in a greenhouse production system.
Materials and Methods
Plant Materials and Growth Conditions
In February, “Akihime” strawberry (Fragaria × ananassa) seedlings of a similar size were transplanted into pots (diameter of 18 cm, height of 20 cm) and cultivated in a nursery greenhouse. After 1 month, healthy seedlings of a similar size were covered by a canopy (L×W×H, 180×90×45 cm) of different colored light-quality selective plastic films (T, R, Y, G, B, and P) composed of polyethylene in Hangzhou (119°43'E, 30°15'N), China. The light transmittance of each film was mainly in the corresponding color zone (Suppl. Fig. 1s). The light intensity inside the canopies was adjusted to 50% of the natural light intensity (daily average light intensity about 400 ± 20 µmol·m-2·s-1) by covering with shading net. The daily average temperature was at 25 ± 2°C, and the relative humidity was 60 ± 5%. Ten pots of strawberry seedlings were cultivated in each shed with normal management, and each pot was watered with 500 mL distilled water every 3 days. During the ripening period (after 50 ‑ 60 days), the growth status (after 60 days) and photosynthetic abilities (after 55 days) were investigated, and the fruit was harvested for quality measurements.
Measurement of Petiole Length, Leaf Area, Leaf Biomass, and Shoot Biomass
The petiole length of strawberry plants was measured by a ruler. The leaf area was calculated by software Image J (National Institutes of Health, USA) after taking photos. The strawberry shoots were harvested, heated to deactivate enzymes at 105°C for 30 min, and dried at 60°C to constant weight for analyzing the dry weight of leaves and shoots.
Determination of Photosynthetic Pigment Content
Leaf discs (diameter of 6.78 mm) from mature strawberry leaves were immediately frozen by liquid nitrogen and ground by a mortar and pestle with 2 mL 96% ethanol. After centrifugation at 5000 rpm for 10 min, the extracts were measured at 470, 649, and 665 nm. The concentration of Chl a, Chl b, and Cx+c was calculated using the equations described by Lichtenthaler and Wellburn (1983). Then, the content (µg·cm-2) of pigments in leaves and the ratio of Chl a/b were calculated.
Measurement of Chl Fluorescence Transients
The mature leaves of strawberry plants were adapted in darkness for 15 min, and Chl fluorescence transients were measured by using a Yaxin-1161 Chl fluorescence analyzer (Yaxinliyi Science and Technology Co., Ltd., Beijing, China) according to the method of Strasser and Srivastava (1995). The Chl fluorescence parameters, such as maximum photochemical quantum yield of photosystem II (PSII) (φPo), electron transfer efficiency caused by the captured excitons (Ψo), quantum yield of electron transfer (φEo), maximum quantum yield of non-photochemical deexcitation (φDo), density of reaction centers per excited cross section (RC/CSm), and photosynthetic performance index (PIabs), were estimated using the equations (1 ‑ 6) described below according to Strasser et al. (2004).
| $$\mathrm{φPo}=(\mathrm{Fm}‑\mathrm{Fo})/\mathrm{Fm}$$ | (1) |
| $$\mathrm{Ψo}=\mathrm{ETo}/\mathrm{TRo}$$ | (2) |
| $$φEo = ETo/ABS = (1 ‑ Fo/Fm)×Ψo (3)$$ | (3) |
| $$\mathrm{φDo}=1‑\mathrm{φPo}$$ | (4) |
| $$\mathrm{RC}/\mathrm{CSm}=\mathrm{φPo}\times(\mathrm V/\mathrm{Mo})\times(\mathrm{ABS}/\mathrm{CSm})\approx\mathrm{φPo}\times(\mathrm V/\mathrm{Mo})\times\mathrm{Fo}$$ | (5) |
| $$\mathrm{PIabs}=(\mathrm{RC}/\mathrm{ABS})\times\lbrack\mathrm{φPo}/(1‑\mathrm{φPo})\rbrack\times\lbrack\mathrm{Ψo}/(1‑\mathrm{Ψo})\rbrack$$ | (6) |
Where, Fo is the minimum fluorescence when all PSII reaction centers are open. Fm is the maximum fluorescence when all PSII reaction centers are closed. ETo is the electron transport flux at time (t) = 0. TRo is the trapped energy flux at t = 0. ABS is the absorption flux. RC is PSII reaction center. CSm is cross section of leaf tissue. V is relative variable fluorescence. Mo is the approximated initial slope of the fluorescence transient.
Measurement of Fruit Weight
The 2nd to 4th fruit harvested from each plant were weighed and their means were considered as the value of the fruit weight of the plant, with each plant as a replicate.
Measurement of Sugar Content in Strawberry Fruit
Strawberry fruit harvested from each plant were sliced into small segments and mixed well. Then 0.2 g of mixed fruit were ground with 6 mL of 80% ethanol, decolorized by adding 0.8 g activated carbon, and centrifuged at 8,000 rpmat 4°C for 30 min. The supernatant was used to determine the content of sucrose and reducing sugar (Cheng et al., 2008; Jing et al., 2017).
For the determination of sucrose content, a mixture of 100 µL supernatant and 100 µL 30% KOH solution was placed in a water bath at 100°C for 10 min, incubated at 40°C for 15 min after adding 3 mL anthrone reagent, then the OD620 was measured. A standard curve of sucrose solution was made to calculate the content of sucrose in the fruit.
To determine reducing sugar content, 2 mL of 3,5-dinitrosalicylic acid was added into 500 µL supernatant, and the OD540 of the mixture was measured. The reducing sugar standard curve was made by using glucose as the standard sample, then the reducing sugar content was calculated.
The total sugar contents (7) were calculated according to the following formula:
| $$\mathrm{Total}\;\mathrm{sugar}=\mathrm{sucrose}+\mathrm{reducing}\;\mathrm{sugar}$$ | (7) |
Determination of Soluble Protein Content in Strawberry Fruit
The mixed fruit (0.4 g) was ground with potassium phosphate buffer solution at pH 7.8 using a mortar and pestle. After centrifugation at 4°C, the supernatant was obtained and used to determine the soluble protein content using Coomassie Brilliant Blue G-250 solution according to the method of Bradford (1976).
Measurement of Anthocyanin Content in Strawberry Fruit
The mixed fruit (1 g) was ground using 3 mL ethanol-hydrochloric acid extracting solution (70% ethanol:0.1 mol·mol-1 hydrochloric acid, 9:1). The homogenate was kept in the dark at 4°C for 6 h. After centrifugation at 4°C, the supernatant was harvested, while the sediment was extracted again by 1 mL extracting solution. The supernatants were combined and 1 mL of the mixture was added to 4 mL hydrochloric acid buffer solution (pH 1.0) and acetic acid buffer solution (pH 4.5) to determine the OD510 and OD700 (Cheng and Breen, 1991). Pelargonidin-3-O-glucoside, the main anthocyanin in strawberry fruit, was used as the standard (Duarte et al., 2018).
Calculations and Statistical Analyses
In each shed, 6 strawberry plants were randomly selected for measurement, and each plant was considered as a replicate. One-way ANOVA was carried out using Origin 8.0 (Origin Lab, Northampton, MA) to compare the difference between treatments, and the graphs were also drawn using the same software.
Results
Growth Status of Strawberry Plants under Different Colored Light-Quality Selective Plastic Films
Strawberry plants under different colored light-quality selective plastic films showed significant differences in the growth status. The leaf area under R film was the largest, and it was significantly (p < 0.05) larger than that under G and B films. The petiole length in T and B film treatments was 15.4% (p < 0.05) and 12.9% (p < 0.05), 11.8% (p < 0.05) and 9.2%, 15.5% (p < 0.05) and 13.0% (p < 0.05), and 17.4% (p < 0.05) and 15.0% (p < 0.05) shorter than that under R, Y, G, and P film, respectively. Similar to leaf area, the maximum leaf biomass was also detected under R film, and it was 1.8 ‑ (p < 0.05), 2.4 ‑ (p < 0.05), 2.0 ‑ (p < 0.05), 1.9 ‑ (p < 0.05), and 1.8-fold (p < 0.05) greater than that under T, Y, G, B, and P film, respectively. For the shoots, the maximum biomass was detected under R film, and it was significantly (p < 0.05) higher than that under other films (Table 1).
Table 1.
Effects of different colored light-quality selective plastic films on strawberry plant growth
Photosynthetic Pigments under Different Colored Light-Quality Selective Plastic Films
The highest content of Chl a, Chl b, and Cx+c in strawberry leaves was detected under R film, while the lowest content of Chl a was detected under P film, Chl b under G and B films, and Cx+c under T film. The ratio of Chl a/b under G and B films was significantly (p < 0.05) higher than that under T and P films(Table 2).
Table 2.
Effects of different colored light-quality selective plastic films on photosynthetic pigments in strawberry leaves
Chl Fluorescence Parameters under Different Colored Light-Quality Selective Plastic Films
R film showed the maximum positive effect on φPo, which was significantly (p < 0.05) higher than that in the G and P film treatments (Fig. 1A). The maximum Ψo was detected under the T film, but with no significant differences with that under R, Y, G, and B films (Fig. 1B). R and B films obviously promoted φEo, while G and P films reduced φEo, with a reduction of 23.1% (p < 0.05) and 38.7% (p < 0.05), respectively, compared to the R film treatment (Fig. 1C).
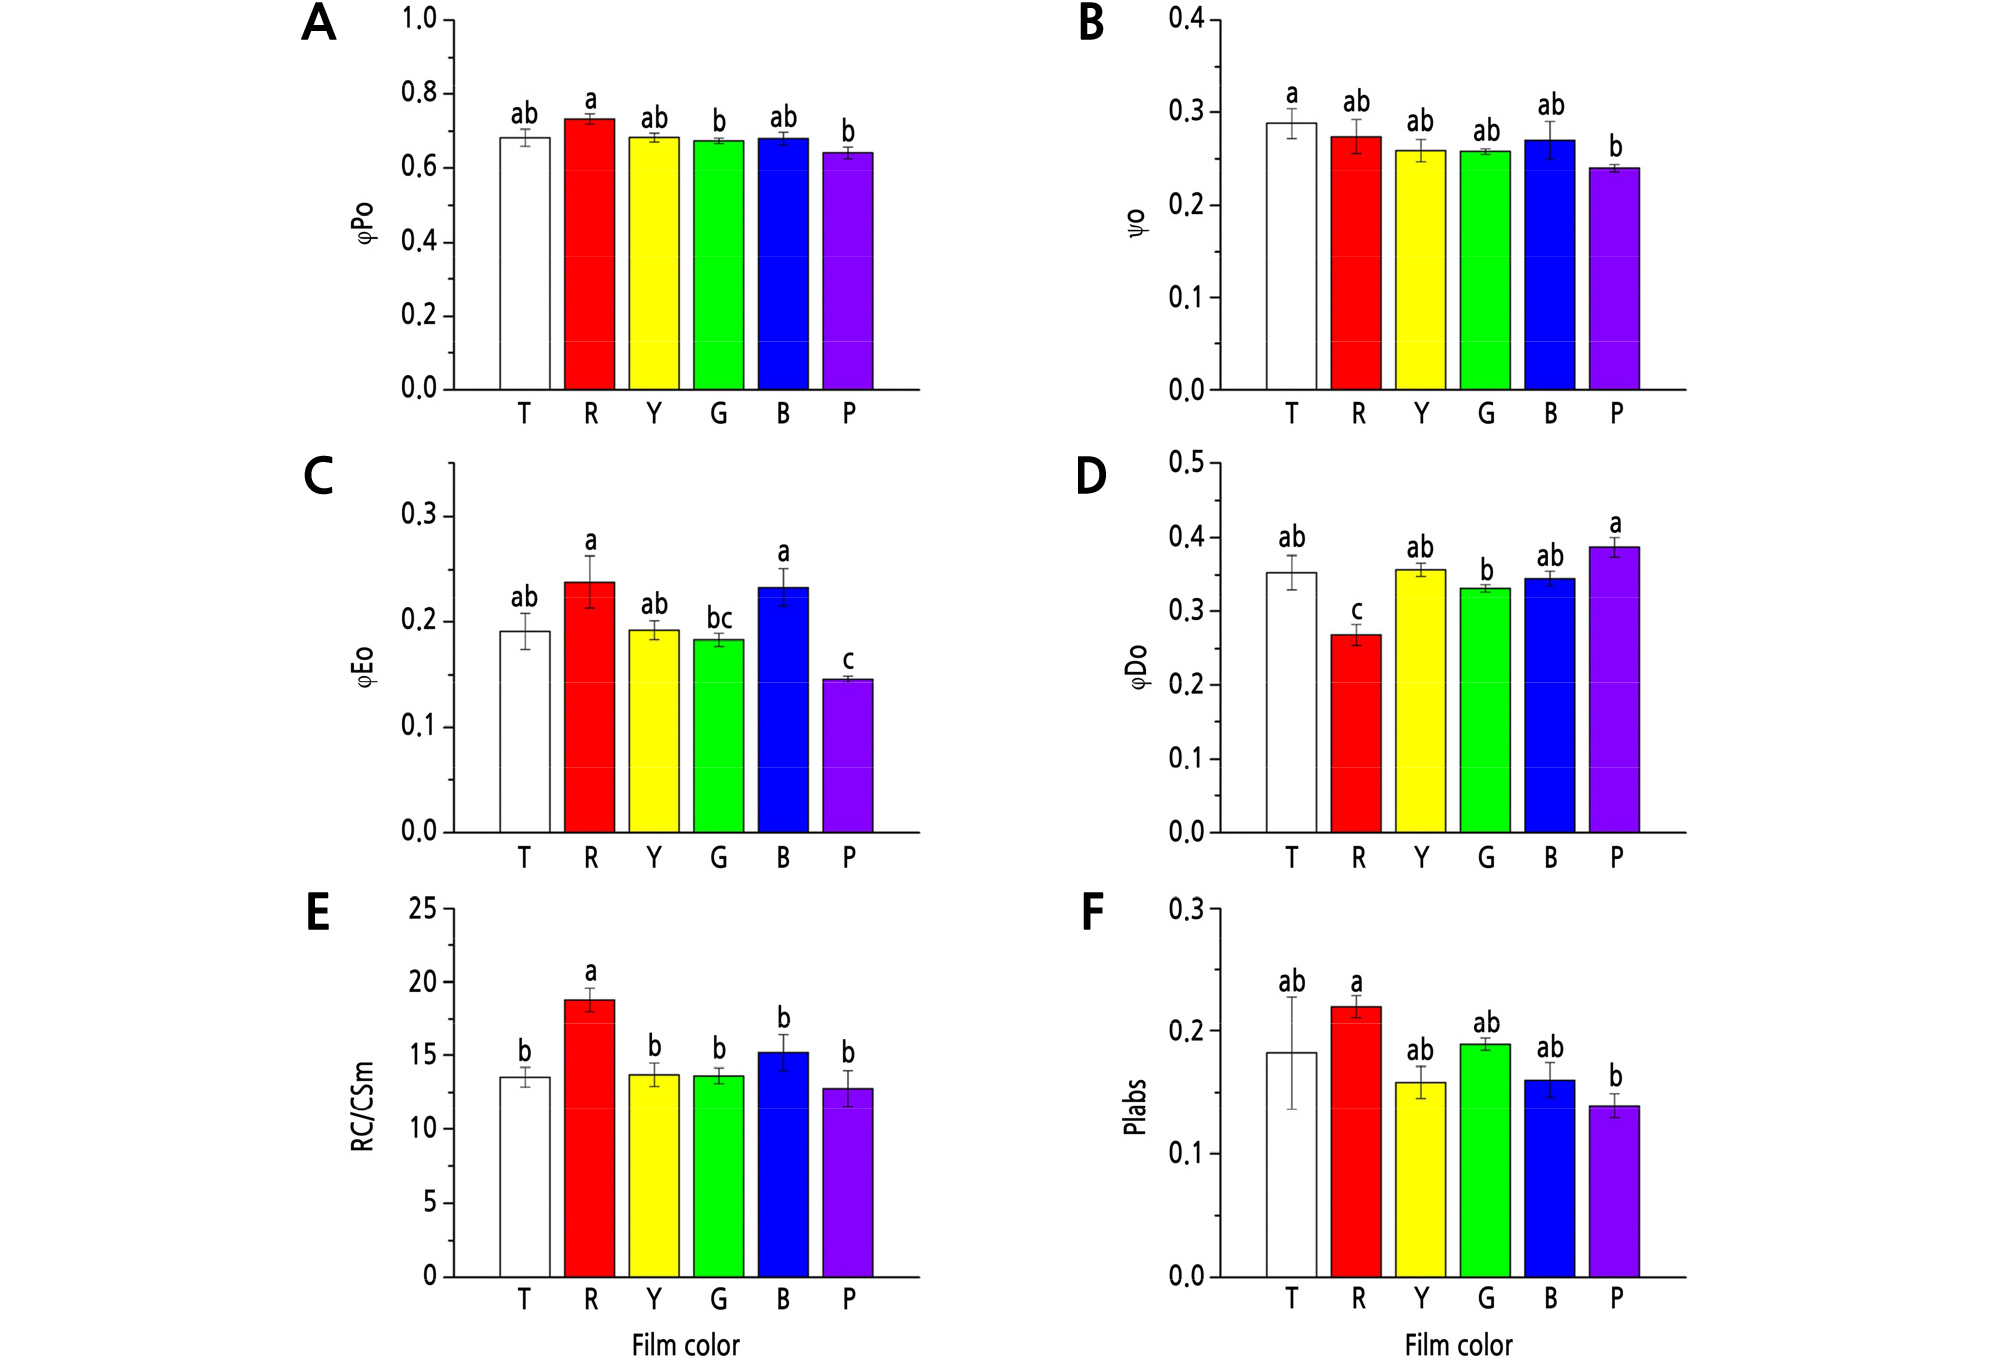
Fig. 1.
Effects of different colored light-quality selective plastic films on chlorophyll fluorescence parameters in strawberry leaves. A: φPo; B: Ψo; C: φEo; D: φDo; E: RC/CSm; F: Plabs. T: transparent film; R: red film; Y: yellow film; G: green film; B: blue film; P: purple film. Different lowercase letters indicate a significant difference at the level of p < 0.05. Mean ± SE (n = 6).
φDo was significantly lower under R film than that under T, Y, G, B, and P films, with a decrease of 24.1% (p < 0.05), 24.9% (p < 0.05), 19.3% (p < 0.05), 22.3% (p < 0.05), and 30.7% (p < 0.05), respectively (Fig. 1D).
The R film significantly (p < 0.05) increased RC/CSm compared to other treatments (Fig. 1E), and also had a positive effect on PIabs (Fig. 1F). Compared to R film, P film significantly decreased PIabs, with a decrease of 36.8% (p < 0.05) (Fig. 1F).
Fruit Qualities under Different Colored Light-Quality Selective Plastic Films
Among the treatments with T, R, Y, G, B, and P films, R film showed the maximum positive effect on fruit weight; fruit weight was 20.1% (p < 0.05) and 49.3% (p < 0.05) heavier under R film than that under T and P film, respectively (Fig. 2A).
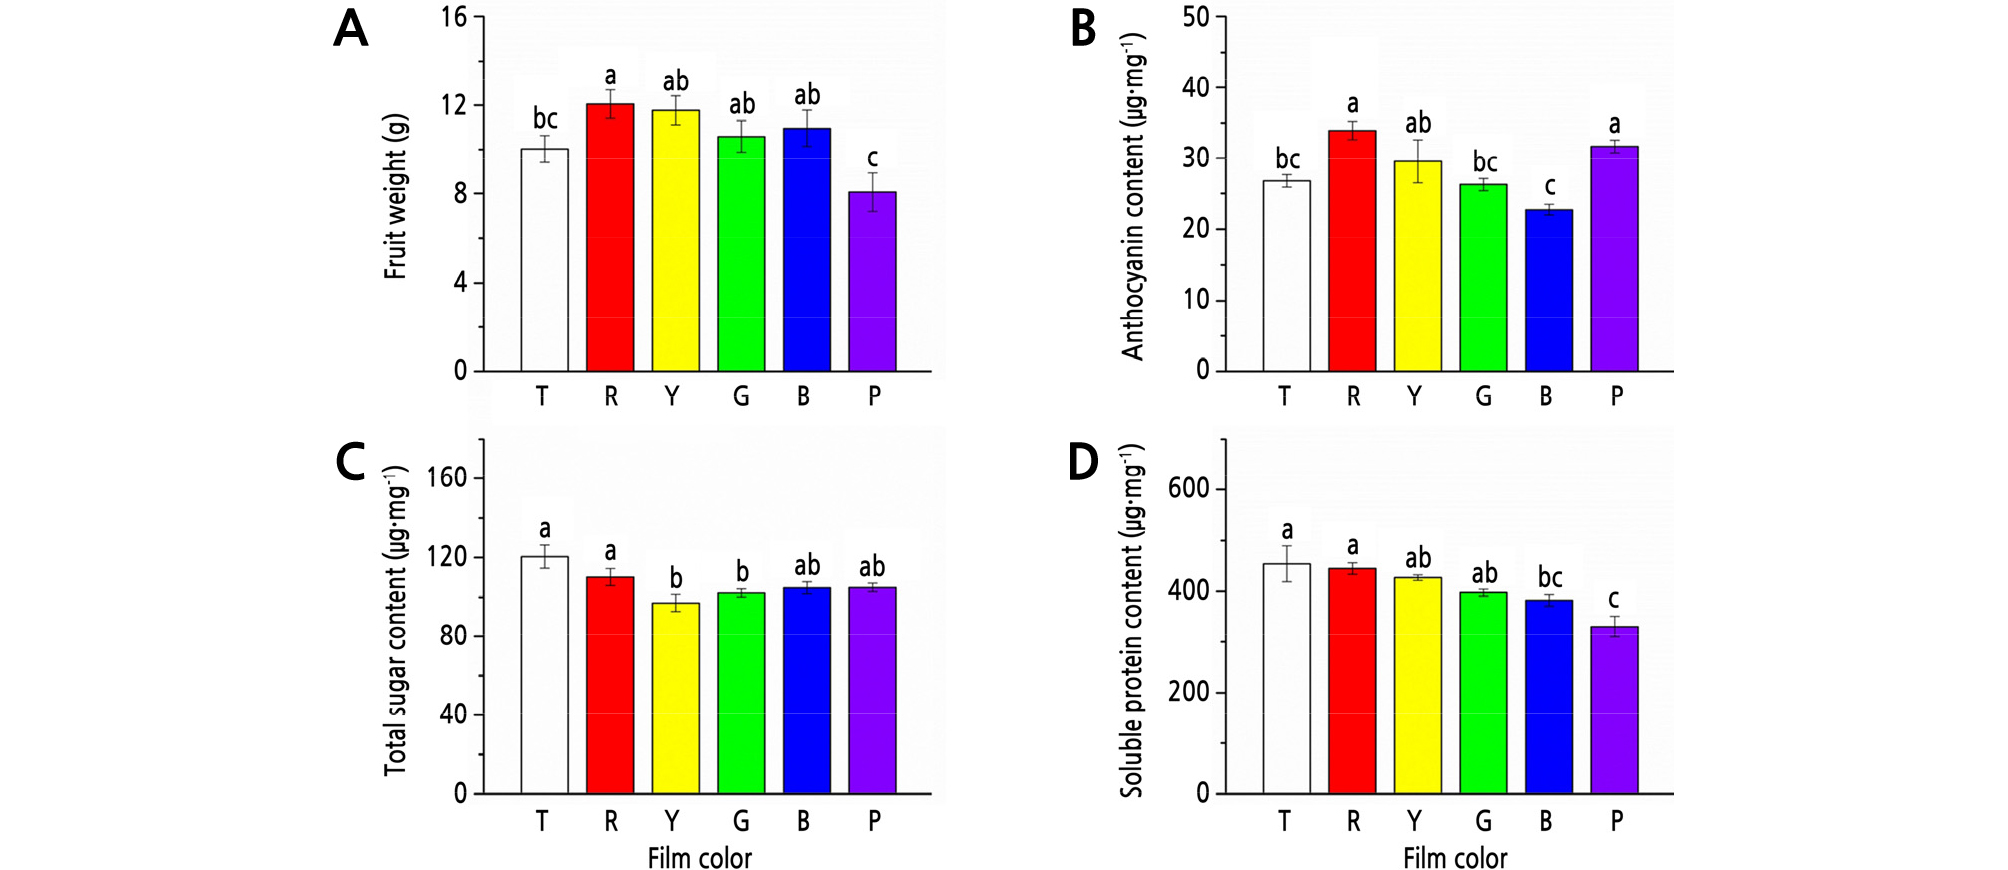
Fig. 2.
Effects of different colored light-quality selective plastic films on strawberry fruit qualities. A: fruit weight; B: anthocyanin content; C: total sugar content; D: soluble protein content. T: transparent film; R: red film; Y: yellow film; G: green film; B: blue film; P: purple film. Different lowercase letters indicate a significant difference at the level of p < 0.05. Mean ± SE (n = 6).
For anthocyanin, the highest content was detected under R film, which was 26.8% (p < 0.05), 28.7% (p < 0.05), and 41.8% (p < 0.05) higher than that under T, G, and B films, respectively (Fig. 2B).
T film showed the highest content of total sugar and soluble proteins, but with no significant differences with R film. Compared to the treatments with T and R films, Y and G film treatments significantly (p < 0.05) decreased the content of total sugar, and B and P film treatments significantly (p < 0.05) decreased the content of soluble proteins (Fig. 2C and 2D).
Discussion
In modern agriculture, producers regulate the growth and development of crops by controlling light quality (Li and Kubota, 2009; Hogewoning et al., 2010; Wu et al., 2014). It was reported that the specific leaf area of Acacia mangium seedlings under R, B, and Y light was larger than that under white light (Yu and Ong, 2003). In perennial ryegrass (Lolium multiflorum), B light markedly suppressed the growth of the leaf sheath (Casal and Alvarez, 1988). Plant height, leaf area, root length, and plant weight of tomato under B and Y light were lower than those under R light (Wu et al., 2014). However, these growth parameters of rape (Li et al., 2013) and tomato (Li et al., 2017a) can be improved under R-B mixed light. In the present study, the leaf area, petiole length, leaf biomass, and shoot biomass of strawberry plants were significantly influenced by different colored light-quality selective plastic films, with a promotion of these parameters under the R film, and varied inhibitions under other films (Table 1). This result was similar with previous studies (Casal and Alvarez, 1988; Yu and Ong, 2003; Wu et al., 2014), which may result from the R light up-regulating the expression of a primary auxin response gene OsiIAA1 and increasing auxin content in plants (Thakur et al., 2005; Islam et al., 2014).
Chl and Cx+c exist in chloroplast grana and are involved in the absorption and transmission of light in photosynthesis. Previous studies reported that the Chl content in grape (Vitis vinifera), cotton (Gossypium hirsutum), and chrysanthemum leaves increased under B light and decreased under R light (Poudel et al., 2008; Kurilčik et al., 2008; Li et al., 2010). While one study reported that the content of Chl a, Chl b, and Cx+C in strawberry plants under R light were much higher than those under B light (Choi et al., 2015), another study reported that the Chl a/b ratio in the B light treatment was much higher in contrast to that in the R light treatment (Abadía et al., 1999; Li et al., 2013). The present study also demonstrated that the content of Chl a, Chl b, and Cx+c in strawberry leaves under B and P films was much lower than that under R film. Meanwhile, T, Y, and G films also reduced the photosynthetic pigment content. The plants under B film had a higher Chl a/b ratio than that in the other treatments, indicating that B light had adverse effects on the synthesis of Chl b (Table 2).
Photosynthesis is the most basic energy conversion process in plants. The absorption, distribution, and utilization of light energy during the process can be reflected by Chl fluorescence parameters (Papageorgiou, 1975; Markou and Muylaert, 2016).φPo is the maximum photochemical quantum yield of PSII, which can reflect the potential energy conversion efficiency of the PSII reaction center (Strasser and Srivastava, 1995). Wu et al. (2014) found that the actual photochemical efficiency in tomato slightly increased under B light, was unchanged under R light, but markedly reduced under G and Y light. In addition, φPo in cucumber leaves decreased under P light, indicating that photoinhibition of PSII reaction centers has occurred (Wang et al., 2009). Similarly, φPo in strawberry leaves under G and P films was significantly lower than that in the R film treatment, suggesting that G and P films may cause the inactivation or damage of the PSII reaction center (Fig. 1A).
Ψo is a parameter describing the electron transfer efficiency caused by the captured excitons, and φEo represents the quantum yield of electron transfer. It was demonstrated that the electron transport rate in tomato leaves increased under B and R light, while it decreased under G and Y light (Wu et al., 2014). Similar results were also detected in the present study. R film showed promoting effects on the two parameters, while G and P films inhibited the quantum production and electron transport in PSII (Fig. 1B, and 1C). Compared to other treatments, R film significantly increased RC/CSm in strawberry plants (Fig. 1E), indicating that R film can increase the photosynthetic units. PIabs is a combined parameter which reflects light energy absorption, excitation energy trapping, and conversion of excitation energy to electron transport (Strauss et al., 2006; Zhao et al., 2016; Zuo et al., 2017). R film showed positive effects on the PIabs in strawberry plants (Fig. 1F), demonstrating that R film was beneficial to the photochemical process.
During the photoreaction, the solar energy absorbed but not used for electron transfer can be dissipated as heat via the xanthophyll cycle (Haripal et al., 2006; Gao et al., 2016; Xu et al., 2017). φDo is a parameter that represents the dissipation of that solar energy. It was lowest under R film, suggesting that strawberry plants can increase the utility of the absorbed solar energy and reduce the heat dissipation under R film, while the reverse happened in other treatments (Fig. 1D).
Fruit growth and development mainly result from the input of photosynthetic products. Soluble carbohydrates are main primary metabolites in plants, whose accumulation is affected by photosynthesis (Koch, 2004; Li et al., 2017a). Zheng et al. (2008) found that R light can promote photosynthetic product accumulation. The total carbohydrates in tomato leaves increased under R and R-B mixed light, and the fructose and glucose content was the highest under R light and the lowest under B and P light (Li et al., 2017a). The content of fructose, glucose, and sucrose in strawberry fruit under R light was much higher than that under B light (Choi et al., 2015). In Asparagus (Asparagus officinalis), the sugar content increased in the R light treatment, while it declined in the B light treatment (Mastropasqua et al., 2016). Similarly, R film also showed promoting effects on strawberry fruit weight (Fig. 2A) and accumulation of total sugar (Fig. 2C), sucrose, and reducing sugar (data not shown), which may result from a large input of photosynthetic products provided by the large leaves and high photosynthetic abilities under the film (Fig. 1, Table 1). In addition, R film was also beneficial to the accumulation of soluble proteins (Fig. 1D), another kind of main primary metabolite, which was consistent with the results of R light on bean (Phaseolus vulgaris) (El-Khawas and Khatab, 2007) and wheat (Triticum aestivum) (Monostori et al., 2018).
Anthocyanins are responsible for red or purple coloration in a variety of fruits, and are major pigments in strawberry fruit (Hong et al., 2016; Miao et al., 2016). Miao et al. (2016) reported that R film showed significant promoting effects on the accumulation of total anthocyanins in strawberry fruit, while G and B films showed inhibitory effects. Similar results were also found in the present study, and the promoting effects under R film could be due to increased activities of enzymes in anthocyanin biosynthesis, including phenylalanine ammonia-lyase, cinnamate-4-hydroxylase, 4-coumarate-CoA ligase, chalcone synthase, chalcone isomerase, and anthocyanidin synthase (Miao et al., 2016).
In general, different colored plastic films can influence the growth, photosynthetic pigment levels, and PSII efficiency in strawberry leaves, as well as the fruit weight and total sugar, soluble protein, and anthocyanin content in the fruit. T and Y plastic films showed varied adverse effects on these indexes, although the transmitted light band of the two films included the R light zone (Suppl. Fig. 1s). The intensity of each specific wavelength of light in composite light was lower than that of the single monochromatic light. Additionally, in several studies, monochromatic light, such as P, B, G, and Y, showed inhibitory effects on plants (Casal and Alvarez, 1988; Wu et al., 2014; Choi et al., 2015; Li et al., 2017a). One or both of the above reasons may result in the negative effects of T and Y plastic films. Overall, the R film promoted plant growth, photosynthetic abilities, and fruit weight and quality, and should be utilized for strawberry production.
Supplementary Material
Supplementary materials are available at Horticultural Science and Technology website (https://www.hst-j.org).
- HORT_20200044_Fig_1s.pdf
Light transmittance of different colored light-quality selective plastic films. The transmitted light of transparent film was a composite light, mainly at ≥ 400 nm, while the light transmittance of red and green films was mainly in the red-light zone and green-light zone, respectively. Blue and purple films showed the main light transmittance band in the blue-purple light zone, and the yellow film showed the main light transmittance band ≥ 500 nm, mainly in yellow, orange, and red light zones.
