

Introduction
Materials and Methods
Experimental materials and environmental conditions
Light spectrum treatment
Growth evaluation
Statistical analysis
Results and Discussion
Introduction
Plant factories are systems that artificially control various environmental factors such as light, temperature, humidity, and nutrient solutions. They enable continuous crop production regardless of climate or location conditions (Kim, 2009). Climate change is a global issue that negatively impacts agriculture. Global warming is predicted to lead to the increased occurrences of droughts and floods and to rising sea levels due to a decrease in glacier coverage, resulting in overall changes in the global ecosystem (Kim and Lee, 2009). Plant factories overcome these adverse conditions and provide a cultivation method that allows for a continuous supply of safe agricultural products to consumers while also enabling the mass production of crops for producers (Lee, 2010).
In plant factory systems, setting and maintaining suitable environmental conditions for each crop will contribute substantially to increased yields and improved quality levels, in turn leading to increased income for farmers. Light notably affects plant growth in plant factories under various environmental conditions. With technological advancements, light-emitting diodes (LEDs) have been introduced in plant factories to apply specific wavelengths of light selectively for many plants, such as perilla (Sul et al., 2022), tulip (Roh and Yoo, 2023) and lettuce (Kang et al., 2016). Changes in the light spectrum considerably influence plant growth, yield, and quality outcomes (Macedo et al., 2011). Moreover, red (R) and blue (B) light are reported to be predominantly absorbed by photosynthetic pigments in plants (Terashima et al., 2009; Carvalho et al., 2011). R light influences stem elongation, shoot growth, and photosynthesis (Yorio et al., 2001), while B light influences plant growth and development, phototropism, stem growth inhibition, leaf expansion, and various other responses (Briggs, 1993). Researchers have also found that green (G) light has strong penetration capability into plant leaves, allowing leaves located beneath the canopy to utilize G light for photosynthesis (Klein, 1992; Smith, 1993; Terashima et al., 2009). In earlier work, an artificial light spectrum combining R, G and B was found to have positive effects on plant growth. Kim et al. (2004a) reported that lettuce cultivated under R, G, and B LED light showed higher fresh and dry weights compared to when this crop was cultivated only under R and B light. Likewise, red leaf lettuce showed similar results in a study by Son and Oh (2015). For carrots, different light quality levels increased β-carotene (Kang et al., 2015). In the present study, we conducted comparisons to determine the most suitable light quality conducive to carrot growth.
Carrots (Daucus carota L.) belong to the family Apiaceae and are root vegetables that contain substantial amounts of carotenoids, which are the precursors of vitamin A. Thus, carrots are particularly beneficial for human eye health. Carrots are also utilized as crops with healthy nutritional components such as dietary fiber and vitamins (Luby et al., 2014; Oh et al., 2017). Although carrots are primarily used for their roots, recent studies have revealed the presence of various functional substances in their leaves (Almeida et al., 2009; Oh et al., 2017). Despite limited studies of carrots in plant factories, researchers have investigated the growth of carrot leaves (Oh et al., 2017). However, research on carrot cultivation as a root vegetable using the nutrient film technique (NFT) in plant factories is limited. In a study by Kang et al. (2015) that provides the ratios of R and B light used for carrot cultivation in earlier works, it was reported that growth and the contents of the physiological active substances increased when R:B = 6:4. In the experiments conducted here, based on this earlier finding, we used R:B = 6:4 as a reference. Therefore, the present study was conducted to determine the optimal light quality of R, G, and B LEDs for peak shoot and root growth of carrots in a plant factory.
Materials and Methods
Experimental materials and environmental conditions
The carrot seeds used here (Dream7, Danong Co., Korea) were sown on urethane sponges measuring 3.5 × 3.5 × 3.0 cm. Once the first true leaves developed, the seedlings were transplanted to a fully controlled plant factory located at Jeju National University. Sowing was conducted on January 7, 2022, and approximately three weeks later, transplanting took place on January 29, 2022. The crop was cultivated for 33 days after transplanting.
The hydroponic cultivation method used was NFT, which employed a cultivation system 240 × 60 × 200 cm in size. To avoid hindering root growth due to the bed height, the height was adjusted using an opaque acrylic material in accordance with the growth of the storage roots. A carrot-specific nutrient solution, formulated based on the optimal content of major elements within the plant (NO3-N:15.0, NH4-N:1.0, P:1.0, K:11.0, Ca:2.0, Mg:1.0, SO4-S:1.0 mM·L-1), was used (Oh et al., 2017). The nutrient solution was supplied when the second true leaf appeared. The pH of the nutrient solution was adjusted to 5.5–6.0, and the electrical conductivity (EC) was set to 1.0 dS·m-1 during the seedling stage and 1.5 dS·m-1 after transplanting. The pH and EC of the nutrient solution were monitored and adjusted to the set point every 1–2 days. The nutrient solution was supplied in a 15-minute supply and 5-minute interruption cycle. The temperature was maintained at 20°C, which was the optimal temperature for carrot growth. The relative humidity was controlled at 55% using a humidifier (NH-5, Hwajeun Eng., Korea) and a dehumidifier (SG-M220S-4, Shinan Green-Tech Co., Ltd., Korea) to maintain a vapor pressure deficit of 0.5–1.2 kPa.
Light spectrum treatment
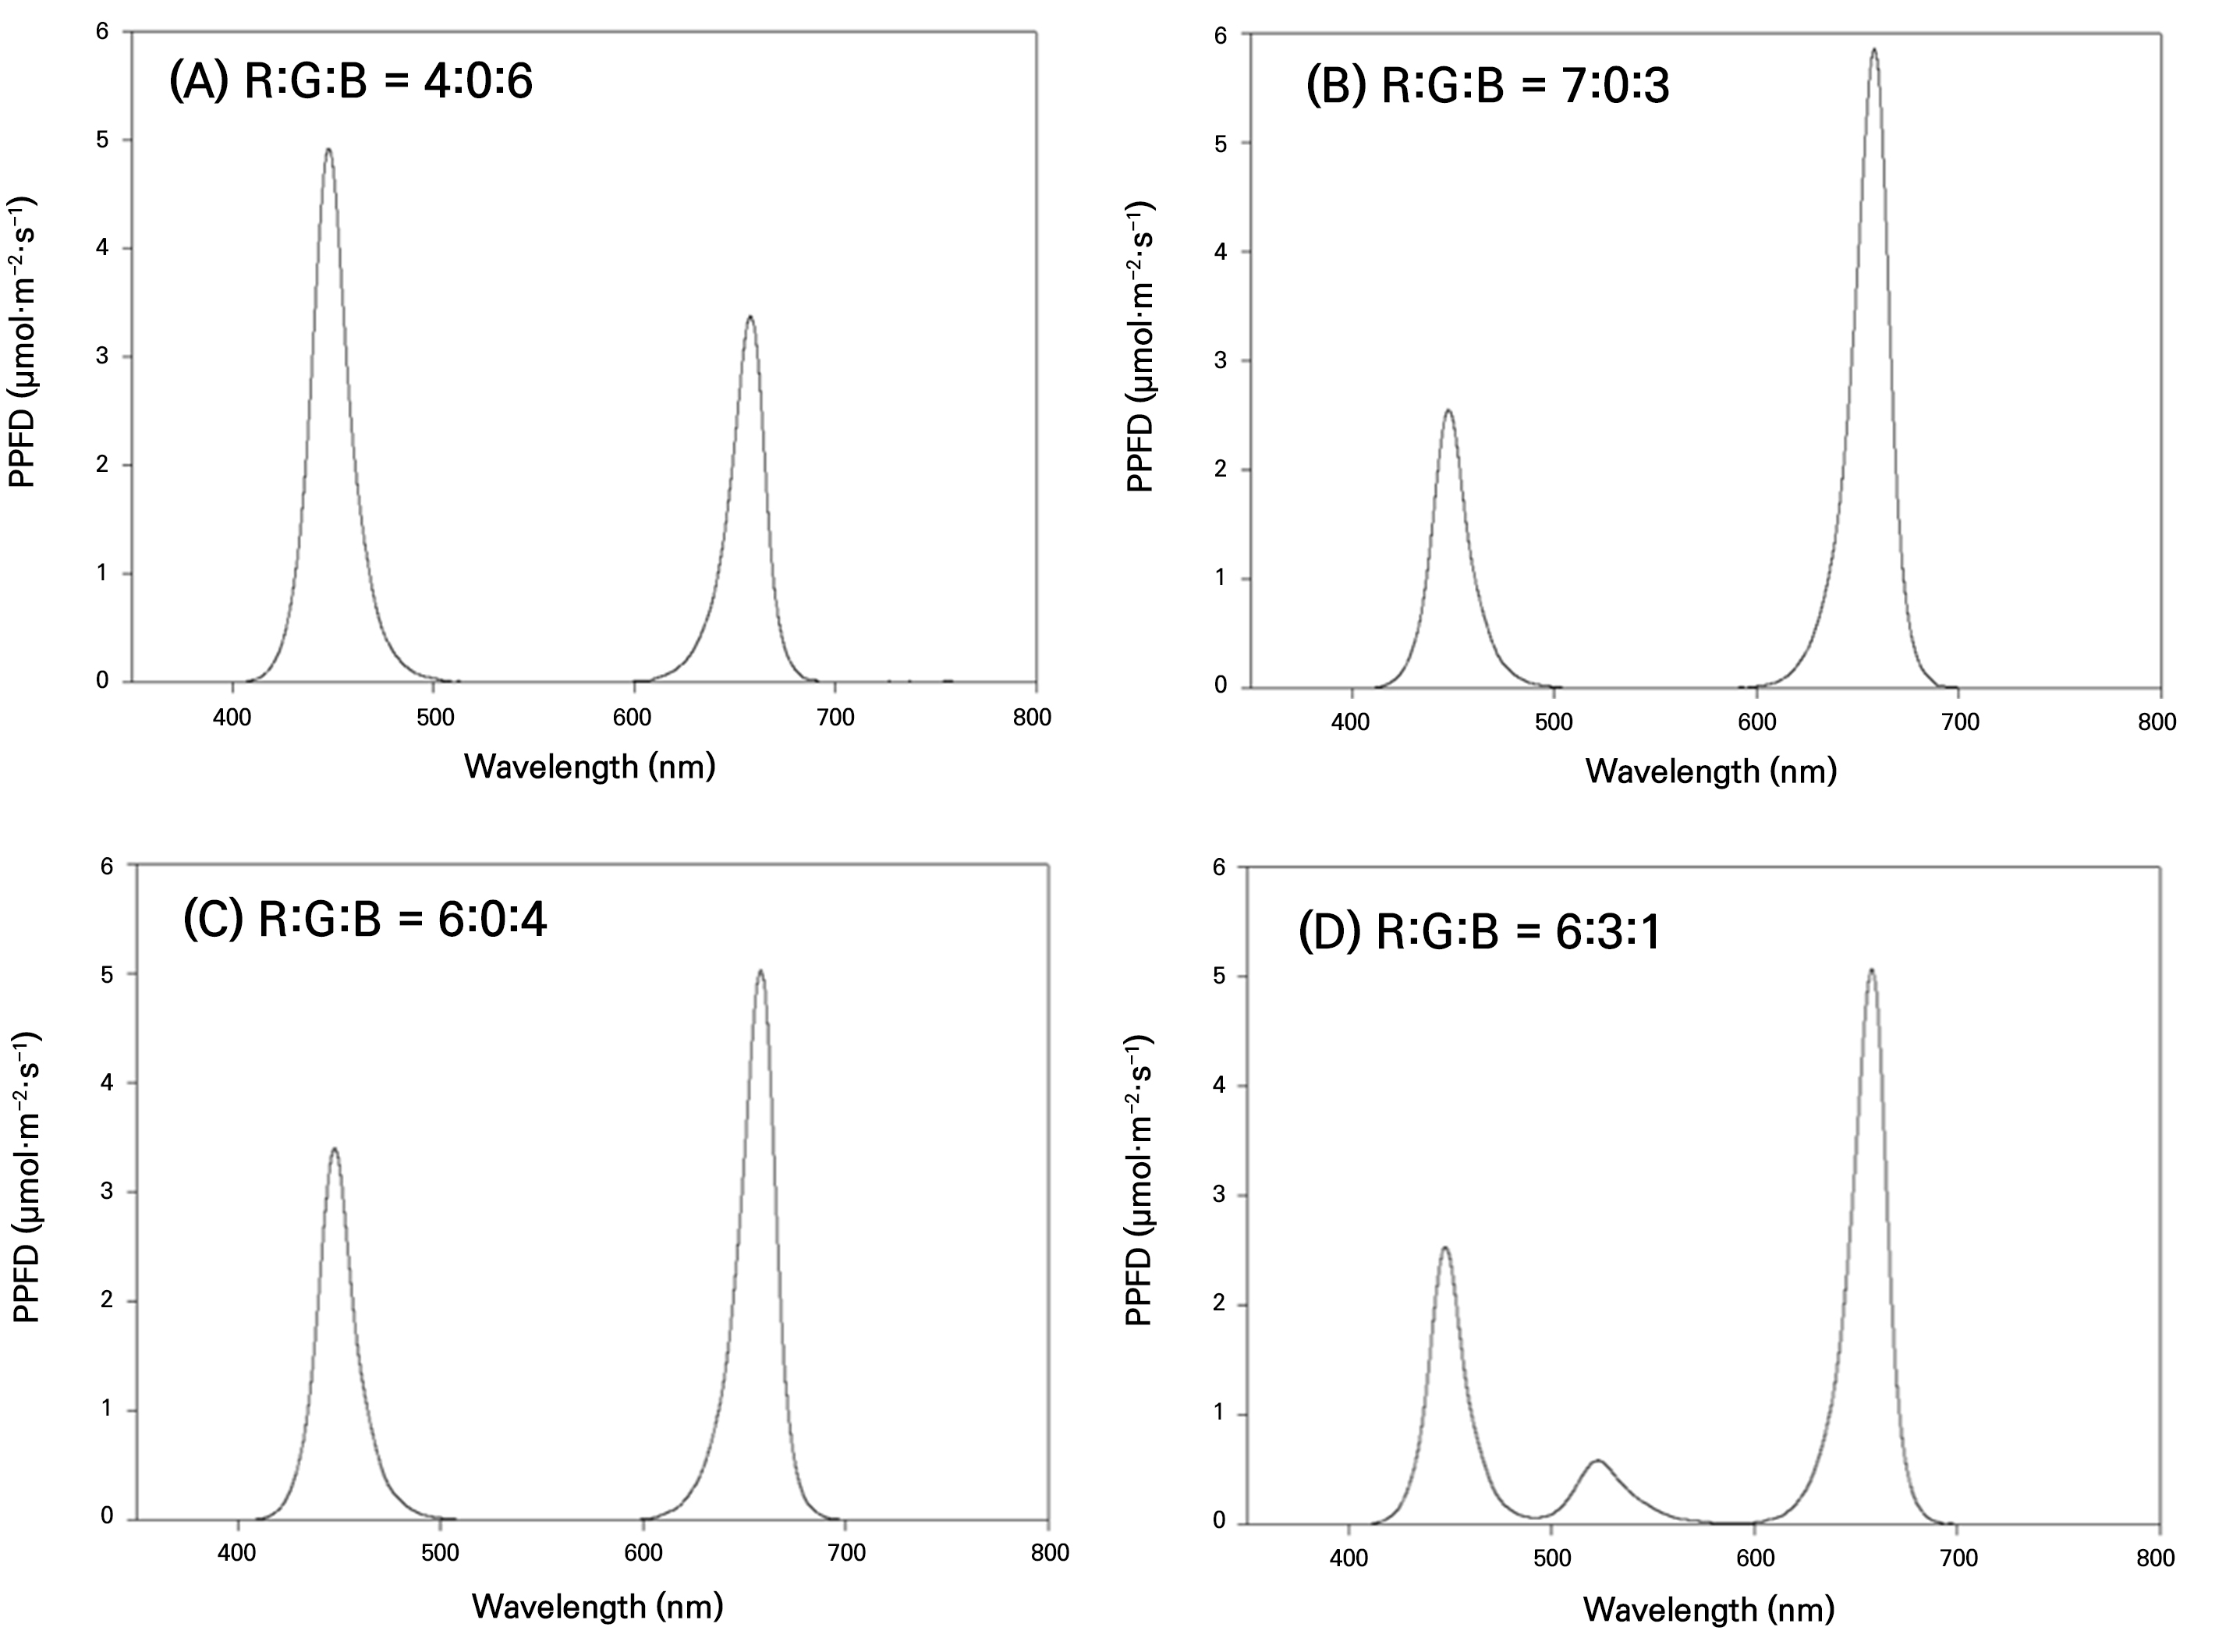
The LED lighting system (HT204, ESLEDS, Korea) measured 600 × 28 × 16 cm and was positioned 30 cm above the bed surface. Four combinations of R (600–700 nm), G (500–600 nm), and B light (400–500 nm) were employed. The ratios of the R, G, and B LEDs were determined based on the following photosynthetic photon flux density (PPFD) values: 4:0:6 (80 µmol·m-2·s-1:0: 120 µmol·m-2·s-1), 7:0:3 (140 µmol·m-2·s-1:0: 60 µmol·m-2·s-1), 6:0:4(120 µmol·m-2·s-1:0: 80 µmol·m-2·s-1), and 6:1:3 (120 µmol·m-2·s-1: 20 µmol·m-2·s-1: 60 µmol·m-2·s-1) (Fig. 1.). The lighting cycle consisted of 12 h of light and 12 h of darkness, and the light intensity was maintained at a fixed value of 200 µmol·m-2·s-1. PPFD was measured using a quantum sensor (LI-190R, LI-COR, Lincoln, NE, USA). Barriers were installed within the plant factory to ensure no interference between the treatment zones.
Growth evaluation
The growth parameters of the carrots were evaluated by measuring the number of leaves, the plant height, and the fresh and dry weights of the shoots and roots. The plant height was measured from the boundary between the shoot and root to the tip of the longest leaf. The number of leaves was determined by considering a leaf with an area of 1 cm² or more as a single leaf. The number of leaves was measured at intervals of 1–2 d. At 33 DAT (days after transplanting), the fresh and dry weights of the shoots and roots were measured using an electronic scale (FX-2000i, AND, Korea). The samples were dried in a drying oven (VS-1202D2, Vision Scientific, Korea) at 70°C for at least 72 h before determination of their dry weights.
Statistical analysis
The experimental design was completely randomized, with six replicates for each treatment. The statistical analysis was conducted using the SAS software (SAS 9.1, SAS Institute Inc., Cary, NC, USA) with Duncan's multiple range test conducted at a 95% confidence level. Graphs were generated using SigmaPlot software (10.0, Systat Software, Inc., Chicago, IL, USA).
Results and Discussion
The number of leaves exhibited a similar trend among all treatments from 15 DAT until approximately 33 DAT, after which differences became apparent (Fig. 2). All treatments exhibited linear trends. In this study, the temperature and light intensity were adjusted to be equal, indicating that the variation in the number of leaves could be attributed to differences in the quality of the light. Treatments with R:G:B ratios of 6:0:4 and 6:1:3 produced the highest number of leaves, although the difference between these two treatments was not statistically significant. According to previous studies, when relatively small amounts of G light of 6 µmol·m-2·s-1 (Kim et al., 2004b) and 15 µmol·m-2·s-1 (Kang et al., 2016) were investigated along with R and B light, the G light did not have a significant effect on the shoot biomass of lettuce. In this experiment, G light was measured at approximately 20 µmol·m-2·s-1 in the R:G:B = 6:1:3 treatment, and there was no significant difference observed between it and the R:G:B = 6:0:4 treatment in terms of growth. This suggests that even 20 µmol·m-2·s-1 may not be a sufficient light intensity level to induce significant growth differences.

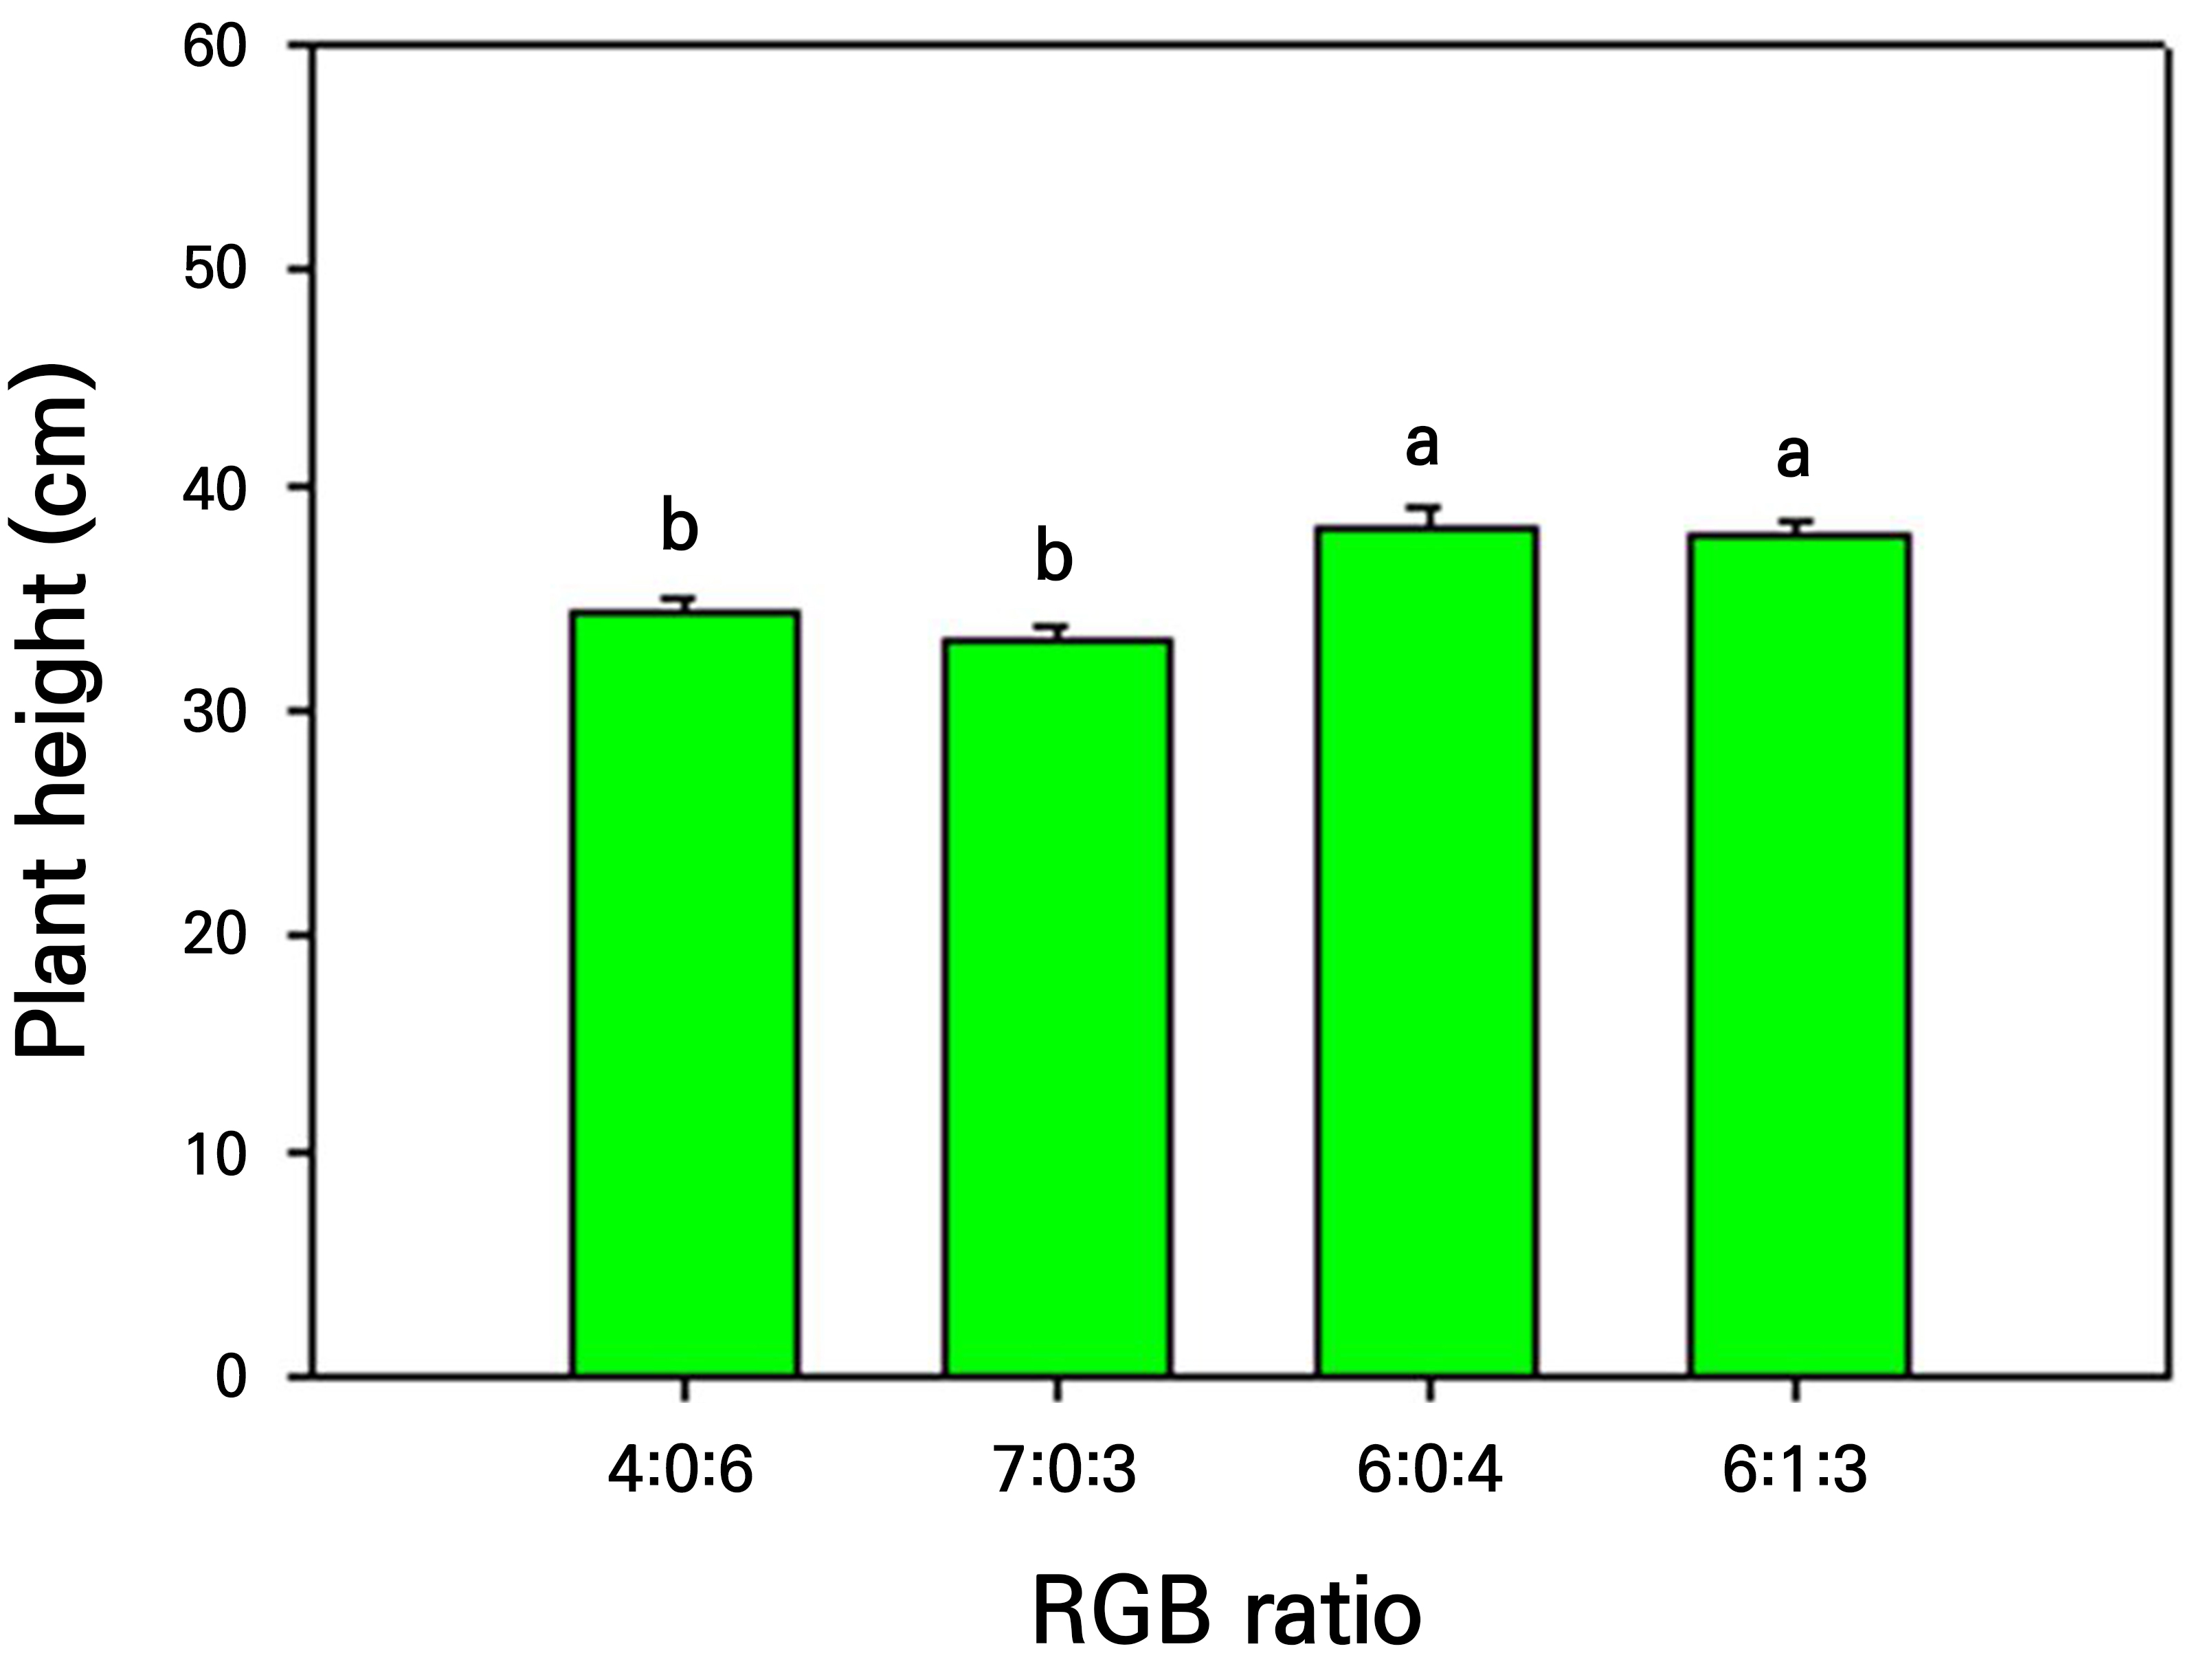
Similarly, there was no statistically significant difference in the plant height at 33 DAT between the 6:0:4 and 6:1:3 ratios, but the height at 33 DAT differed significantly from that after the 7:0:3 and 4:0:6 treatments (Fig. 3). Kang et al. (2015) reported that cultivating carrots under artificial light with an R:B ratio of 6:4 resulted in the tallest plant height, indicating optimal carrot growth under the same R light ratio, as observed in the results of this study. Hence, the quality of light serves as a significant cue for processes such as photosynthesis, photomorphogenesis, and those associated with various plant reactions (Wang et al., 2009).
The fresh shoot and root weights of carrots were also significantly higher in the 6:0:4 and 6:1:3 treatments (Fig. 4). The increases in the fresh weights observed under these two light treatments could be attributed to the increased number of leaves and the taller plant height. It should also be considered that Green light, which has excellent penetration characteristics, can affect crop growth, especially when plants develop complex canopy structures (Klein, 1992; Kim et al., 2004b); the lack of observed differences with the addition of Green light in this experiment could also be due to the relatively short duration of 33 DAT, which did not allow the plants to form densely layered canopy structures.

The shoot and root dry weights of carrot plants were the highest in the 6:1:3 and 6:0:4 treatments, but no statistically significant differences were observed among the treatments (Fig. 5). An interesting observation in this experiment was that the root dry weight was lowest in the 6:1:3 and 6:0:4 treatments, in contrast to the shoot fresh weight. The 4:0:6 treatment resulted in the highest root dry weight, followed by the 7:0:3 treatment. The lower root dry weights in the 6:1:3 and 6:0:4 treatments suggested a higher moisture content in these plants than in the other treatments, whereas the 4:0:6 treatment was speculated to have the highest carbon assimilation rate. Previous studies have reported an increase in the chlorophyll content of various crop species cultivated under Blue light (Matsuda et al., 2007; Hogewoning et al., 2010; Johkan et al., 2010). Based on this, we considered that the promotion of photosynthesis by B light played a significant role in the higher root dry weight observed when using the 4:0:6 treatment.

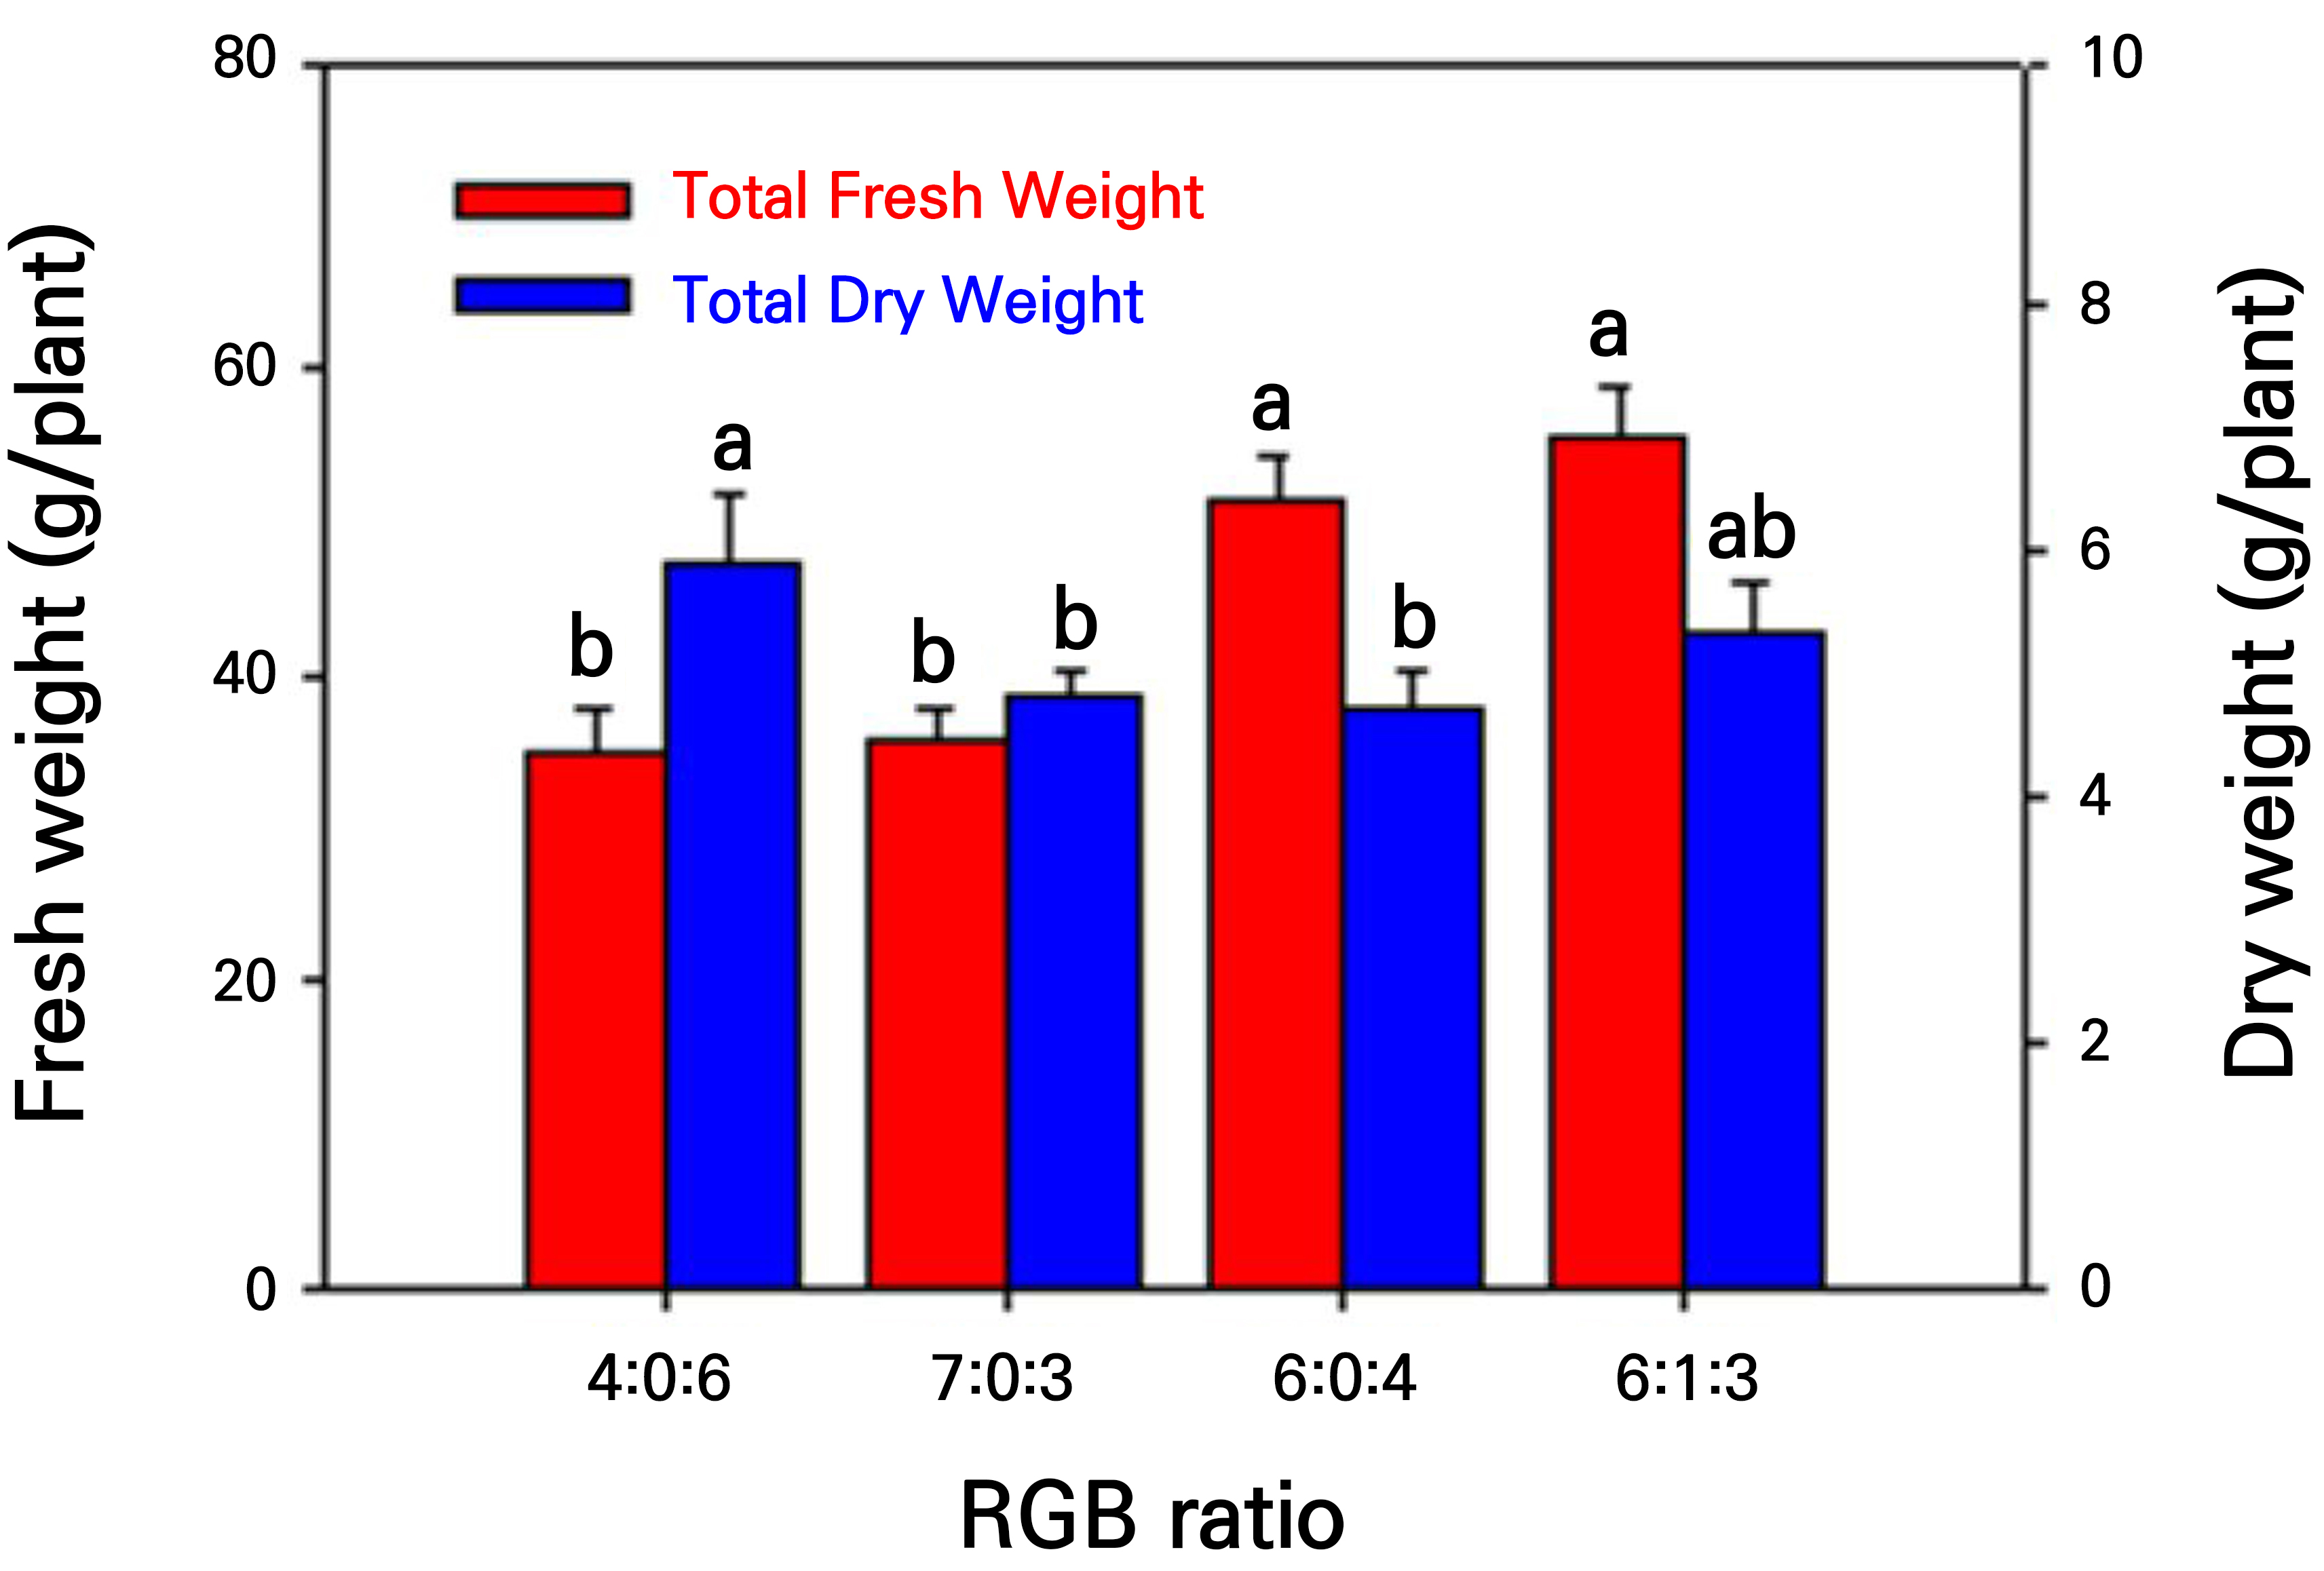
Among the different light quality treatments, the 6:1:3 and 6:0:4 treatments resulted in the highest total fresh and dry weights (Fig. 6). This occurred because both the shoot and root fresh weights were the highest in these treatment groups. The total dry weight was highest in the 4:0:6 treatment group, followed by the 6:1:3 treatment group. The 7:0:3 and 6:0:4 treatments resulted in the lowest total fresh and dry weights, respectively. No statistically significant difference was observed between the 7:0:3 and the 6:0:4 treatments in terms of the total weight.
Based on the results of this study, it was concluded that in a fully controlled plant factory NFT system, carrot growth is most suitable when the ratio of Red light is at 60%. To assess the impact of Green light, a longer cultivation period was required to induce canopy formation relative to the duration of this study. The results for both shoot and root biomasses across the different light treatments showed consistently high values for the 6:0:4 and 6:1:3 treatment groups, with no significant differences. Similarly, the light treatments of the shoot structures yielded identical results.
Although no significant differences in growth performance were observed due to Green light illumination, it provided advantages owing to its relatively high reflectance compared to R and B light when evaluated according to the plant (Klein, 1992; Smith, 1993). Additionally, the addition of G light to a mixture of R and Blue light caused the appearance of the crops to trend toward Green, which is visually familiar to humans (Kim et al., 2004a). Consequently, workers can easily observe the plants, enabling the rapid detection of minor lesions or other abnormalities (Kim et al., 2004a). Considering these benefits, further research on Green light illumination is necessary.
In conclusion, this study investigated the effects of different light quality treatments on carrot growth in plant factories. The results showed that the number of leaves, the plant height, the shoot and root fresh weights, and the total fresh and dry weights were influenced by the Red, Green, and Blue light ratios. Treatments with R:G:B ratios of 6:0:4 and 6:1:3 exhibited favorable outcomes in terms of the number of leaves and the shoot and root weights, although the differences were not statistically significant compared to the other treatments. In contrast, the 7:0:3 and 4:0:6 ratios resulted in significant differences in the plant height and root dry weight. This study also highlights the importance of Red light on overall carrot growth. The optimal Red light ratio for carrot growth was approximately 60%. The effect of Green light was not significant in terms of growth performance, but it provided advantages such as higher reflectance and better visual familiarity. The addition of Green light to the light spectrum facilitates easy observation and the rapid detection of plant abnormalities. However, it is important to note that the duration of the experiment may have limited the assessment of the influence of Green light on canopy formation. Further research with a longer cultivation period is required to gain a fuller understanding of the potential effects of Green light. Overall, this study contributes to our understanding of the effects of different light qualities on carrot growth and highlights the importance of optimizing the Red light ratio in plant factories. Further investigations of the role of Green light and its potential benefits are recommended.
