

Introduction
Materials and Methods
Experimental Site, and Plant Materials
Sink-Source Manipulation
Carpopodium Sampling
Determination of Carpopodium Physical Traits
Preparation and Microscopy Observation of Paraffin Sections
Determination of Carbohydrate Content and Enzyme Activity Related to Carbohydrate Metabolism
Calculation of the Carpopodium Specific Mass Transfer Rate (SMTR)
Data Analysis
Results
Seasonal Variation in the Carbohydrate Content of the Carpopodiums of Girdled Shoots with Different LFRs
Seasonal Variation of the Key Enzyme Activity for Carbohydrate Metabolism in the Carpopodium of Girdled Shoots with Different LFRs
Variations in the Carpopodium of Girdled Shoots with Different LFRs
Correlation Analysis of Multiple Dependent Variables for Walnut Carpopodiums Significantly Affected by the LFR
Discussion
Conclusions
Introduction
In woody plants, the carbohydrates produced by leaves (sources) are first used to meet their own needs for growth and development. The surplus is then translocated from the leaves to other parts of the plant for utilization and storage (sinks) (David, 1985). The process of carbohydrate allocation from sources to sinks is limited by the translocation capacity between the sources and sinks (Chen et al., 2002; Wang and Huang, 2003) and the competitiveness of the sinks (Bel, 1993). The long-distance source-to-sink transport of carbohydrates is driven by the osmotic potential difference (Rae et al., 2005), hydrostatic pressure (Lang, 1983), K+ concentration in phloem sap (Vreugdenhil, 1985; Geigenberger et al., 2010), amino nitrogen compounds (Patrick, 1997), and a decreasing source-to-sink proton motive force (Lalonde et al., 2003). The long-distance source-to-sink transport of carbohydrates can be regulated by changing environmental factors, such as light (Grechi et al., 2007) and water (Hu et al., 2016), or influenced by the regulation of the source-sink relationship (Li et al., 2012; Men et al., 2015). Therefore, it is important to understand how changes to the source-sink relationship in higher plants affect carbohydrate translocation in the phloem.
Some studies on rice (Oryza sativa Linn.) (Pan and Wang, 1998; Zhang, 2003), sweet potato [Dioscorea esculenta (Lour.) Burkill] (Liu, 2014), cotton (Gossypium hirsutum Jimian 958) (Zhang et al., 2016), and wheat (Triticum aestivum Linn.) (Zhou, 2001) have investigated the physical traits of conducting tissues under different source-sink relationships. These studies showed that carbohydrate transport in higher plants is significantly affected by the development of vascular bundles in the phloem, which may sometimes affect its output (Tergeon, 1987). However, some studies have also shown that vascular bundles have a strong transport capacity (except for the apical meristem in stem biology) and do not restrict the transport and allocation of carbohydrates (Ding et al., 1988). The length of vascular bundles, i.e., the distance of carbohydrate transport, can also affect carbohydrate allocation in some cases (Oparka et al., 1994). However, it is generally believed that carbohydrate allocation does not have a significant effect on the length of vascular bundles (Ling et al., 1982). In fact, with sufficient carbohydrate supply, the resistance of vascular bundles may not even affect carbohydrate allocation (Patrick and Offler, 1996).
Other studies use the leaf-to-fruit ratio (LFR) to represent the source-sink relationship and have shown that there is strong carbohydrate metabolic activity in the phloem (Zhou, 2008; Chen, 2014). Under higher LFRs, there is an adequate supply from the sources, which suppresses carbohydrate translocation to the sinks. Under lower LFRs, there is enhanced activity in the sink organs and conducting tissues, which increases the pulling force exerted on the sources, thereby facilitating carbohydrate translocation to the sinks. However, an excessively low LFR will push the carbohydrate output to its maximum capacity and the amount of carbohydrates transported will not increase beyond this limit (Pan and Wang, 1998).
Previous studies that have assessed how changes to the source-sink relationship affect carbohydrate translocation in the phloem have mostly focused on annual herbaceous crops and rarely on perennial fruit trees. Sucrose is a major form of material transported in the phloem of most plants, including walnut trees. However, it is still unclear whether changes to the source-sink ratio affect the carbohydrate transfer rate in the phloem of walnut trees and its internal carbohydrate metabolism.
In this study, we examined walnut trees at the peak fruiting stage to clarify the association between LFR and carbohydrate translocation. We used artificial manipulation of LFR, microscopy observations, leaf sampling, and indoor chemical analysis to investigate the carpopodium specific mass transfer rate (SMTR), physical traits, carbohydrate content, and metabolism-related enzyme activity of girdled fruit-bearing shoots with different LFRs during the growth and development of walnuts.
Materials and Methods
Experimental Site, and Plant Materials
This study was carried out in a walnut orchard located in the Southern Xinjiang, China (41°11'06.31''-41°12'47.74''N, 79°12'12.76''-79°13'57.87''E; 1394 m a.s.l.). The experimental site experiences a warm temperate continental arid climate, with a mean annual temperature of 9.4°C and an average rainfall of 91.5 mm. The uniform 10-year-old walnut tree (Juglans regia L. ‘Xinxin2’) grows at a distance of 5 × 6 m in the east-west rows.
Sink-Source Manipulation
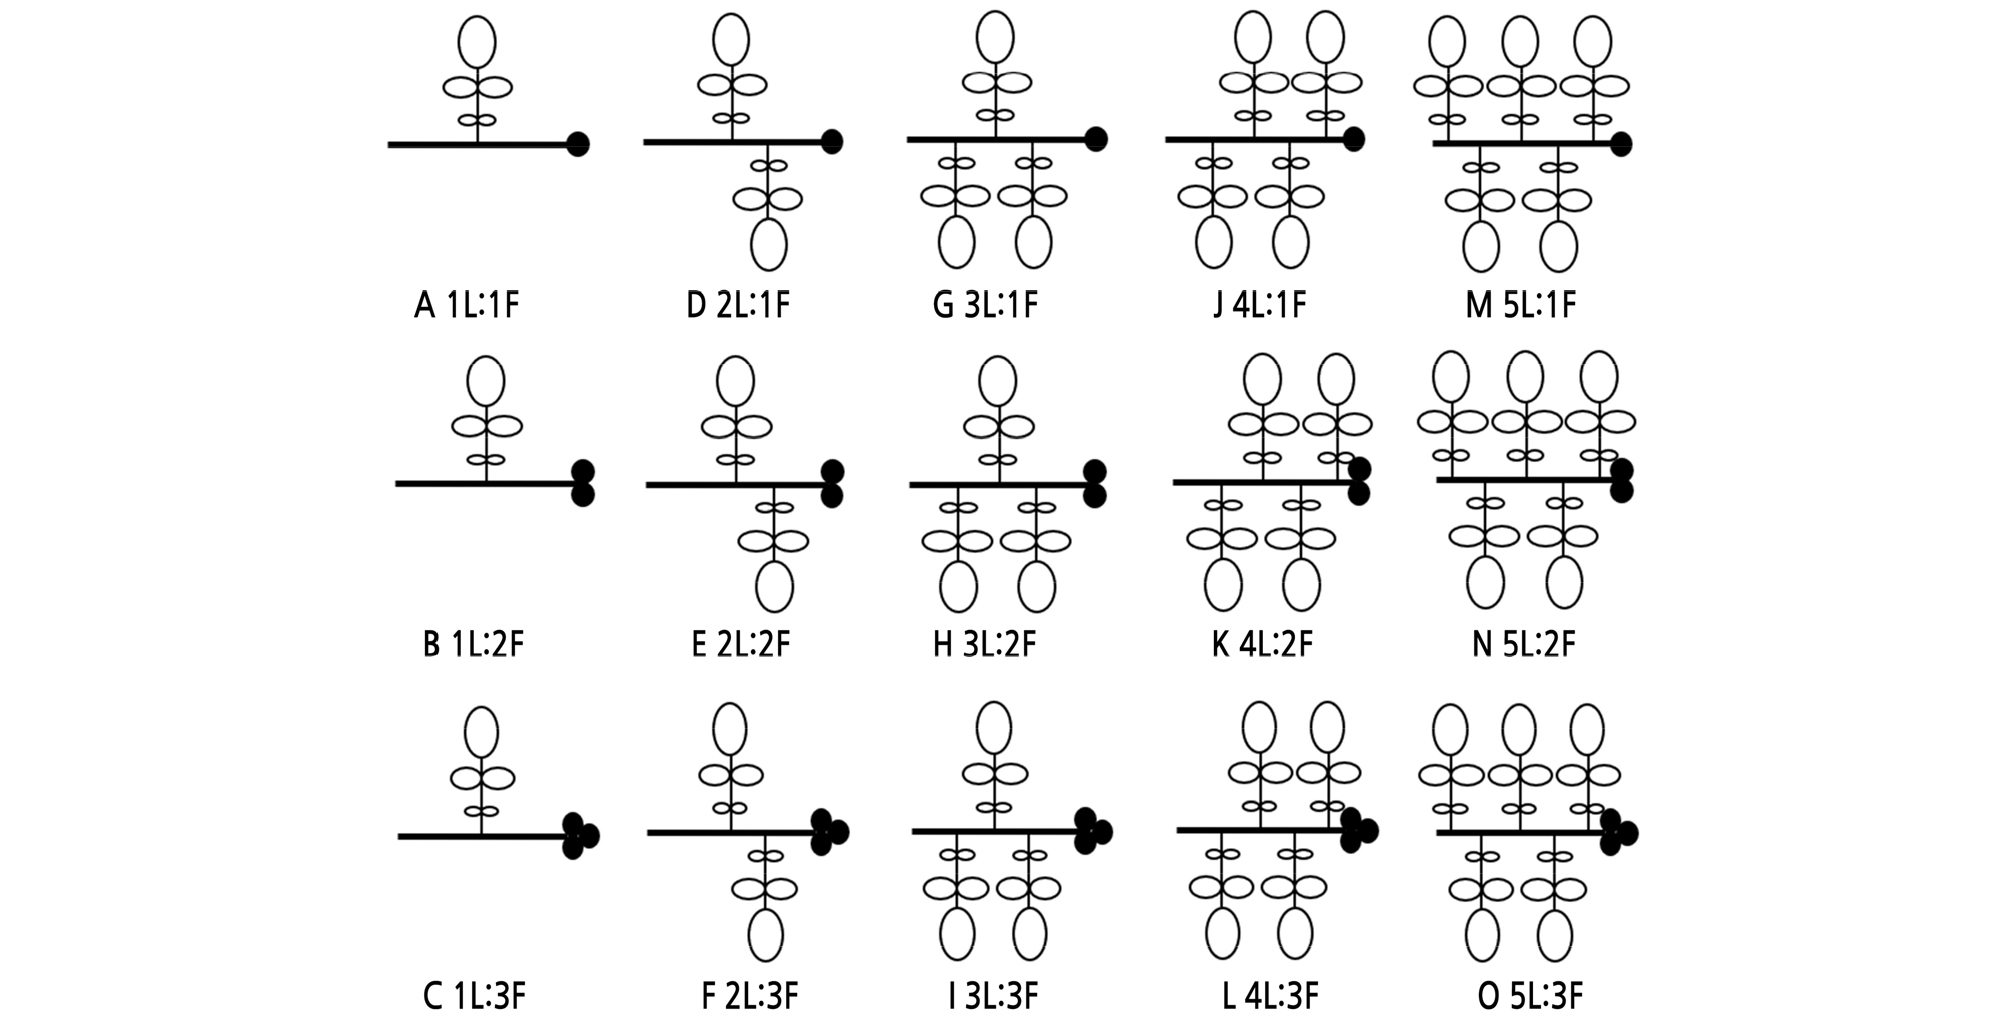
After fruit set, defoliation, girdling, and defruiting were performed on the sun-exposed shoots with fully expanded leaves and developing fruit in the south of 45 trees. Fifteen bearing shoots per tree were treated by one of 15 LFRs (1L:1F, 1L:2F, 1L:3F, 2L:1F, 2L:2F, 2L:3F, 3L:1F, 3L:2F, 3L:3F, 4L:1F, 4L:2F, 4L:3F, 5L:1F, 5L:2F, 5L:3F) (Fig. 1). The specific operation method of sink-source manipulation was done according to our previous research (Zhang et al., 2018).
Carpopodium Sampling
At 45, 70, 90, 110, and 130 d after flowering (7, 32, 52, 72, and 92 d after LFR treatment, respectively), the girdled fruit-bearing shoots of different LFR treatments were collected. Three sample trees were randomly selected for each LFR treatment, and five girdled fruit-bearing shoots were randomly selected from each tree as repeats. Specifically, the carpopodium between the petiole base of the leaf nearest to the fruit and the fruit itself was collected from the girdled shoots. The physical traits of the carpopodium samples were determined after being washed with deionized water and dried. The middle section of the carpopodium was thereafter dipped into FAA fixation solution [70% (φ) ethanol: formaldehyde:glacial acetic acid = 90:5:5] to prepare the paraffin sections. The phloem of the remaining carpopodium was then divided into two sections. The first section was quickly stored in a liquid nitrogen tank for the determination of enzyme activity related to carbohydrate metabolism. The second section was dehydrated in an electric thermostatic air-drying oven (DHG–9240A) at 105°C for 30 min and then dried at 70°C to a constant weight. Samples were finally crushed, passed through a 100-mesh nylon sieve, and used to determine the carbohydrate content.
Determination of Carpopodium Physical Traits
For each LFR treatment, the carpopodium of five girdled shoots was selected to measure the carpopodium length (CL) and diameter (CD) (of the middle section) using a Vernier caliper. The carpopodium diameter growth rate (CDGR, %) and the carpopodium length growth rate (CLGR, %) were then calculated based on the difference in CD and CL between 45 and 130 d after flowering, as follows:
| $$CDLR=\frac{CL_2-CL_1}{CL_2+CL_1}\times\frac2T\times100$$ | (1) |
| $$CDGR=\frac{CD_2-CD_1}{CD_2+CD_1}\times\frac2T\times100$$ | (2) |
where, CDGR (CDLR) is measured in %, CD1 (CL1) is the CD (CL) measured at 45 d after flowering (mm), CD2 (CL2) is the CD (CL) measured at 130 d after flowering (mm), and T is the time interval between the two measurements (d).
Preparation and Microscopy Observation of Paraffin Sections
The carpopodium samples were embedded in paraffin and sliced following the protocol of Willey (1971) using a rotary microtome (Leica Microsystems RM2265). Phloem photos were taken with a DFC495 digital camera and analyzed by AutoCAD 2014 to observe the phloem area (PA) (Zhang et al., 2019). Three procedures were performed in each LFR treatment, and five visual fields were observed repeatedly.
Determination of Carbohydrate Content and Enzyme Activity Related to Carbohydrate Metabolism
Sucrose, fructose, and glucose were measured by ultraviolet spectrophotometry following the Experimental Guide of Modern Plant Physiology (1999), and starch content was measured according to Wang et al. (1993). Frozen samples were used to measure the activities of acid invertase (AI), neutral invertase (NI), sucrose synthetase (SS), and sucrose phosphate synthetase (SPS) by ultraviolet spectrophotometry (Wang and Zhang, 2000).
Calculation of the Carpopodium Specific Mass Transfer Rate (SMTR)
The calculation methods for SMTR in Li Hesheng’s “Modern Plant Physiology” (2012) were followed.
| $$SMTR=\frac{M_2-M_1}{PA\times T\times24}$$ | (3) |
where, SMTR is measured in g·cm-2·h-1, M1 is the mass of dried fruit measured at 45 d after flowering (g), M2 is the mass of dried fruit measured at 130 d after flowering (g), PA is the average of the cross-sectional area of carpopodium phloem between 45 and 130 d (cm2), and T is the time interval between the two measurements (d).
Data Analysis
A two-way multivariate analysis of variance (MANOVA) was used to test if time, LFR, and their interaction had a significant effect on carbohydrate content and its metabolism-related enzyme activity. A one-way MANOVA was used to test whether LFR had a significant effect on the carpopodium traits of girdled shoots. The least significant difference (LSD) method was used for multiple comparisons to determine whether there were significant differences among the different LFR treatments for each dependent variable. Pearson’s correlation was used to calculate the pairwise correlation coefficients of carpopodium dependent variables that were significantly affected by the LFR. The two-tailed method was used to test the pairwise correlation between the dependent variables that were significantly affected by the LFR.
Data analyses were conducted using SPSS 22.0 statistical analysis software. SigmaPlot 10.0 was used to plot the graphs.
Results
The two-way MANOVA (Table 1) revealed if time, LFR, and their interaction had a significant effect on the glucose, sucrose, and starch contents as well as the AI and SPS activities (p < 0.05). However, LFR did not have a significant effect on the fructose content and NI activity (p > 0.05).
Table 1.
Analysis of variance of two factors with multiple response variables testing the effect of time (T) and leaf-to-fruit ratio (LFR) on carbohydrate metabolism in the carpopodium
Seasonal Variation in the Carbohydrate Content of the Carpopodiums of Girdled Shoots with Different LFRs
When the same number of leaves was retained on the girdled shoots, the glucose and sucrose content increased gradually with an increase in the number of fruits. The glucose content for (3 ‑ 5)L:2F and (3 ‑ 5)L:3F was significantly higher than that for (3 ‑ 5)L:1F (p < 0.05) (Fig. 2C-2E). The sucrose content for (1 ‑ 2)L:2F and (1 ‑ 2)L:3F was significantly higher than that for (1 ‑ 2)L:1F (Fig. 3A-3B), and that for (4 ‑ 5)L:3F was significantly higher than that for (4 ‑ 5)L:1F (p < 0.05) (Fig. 3D-3E).
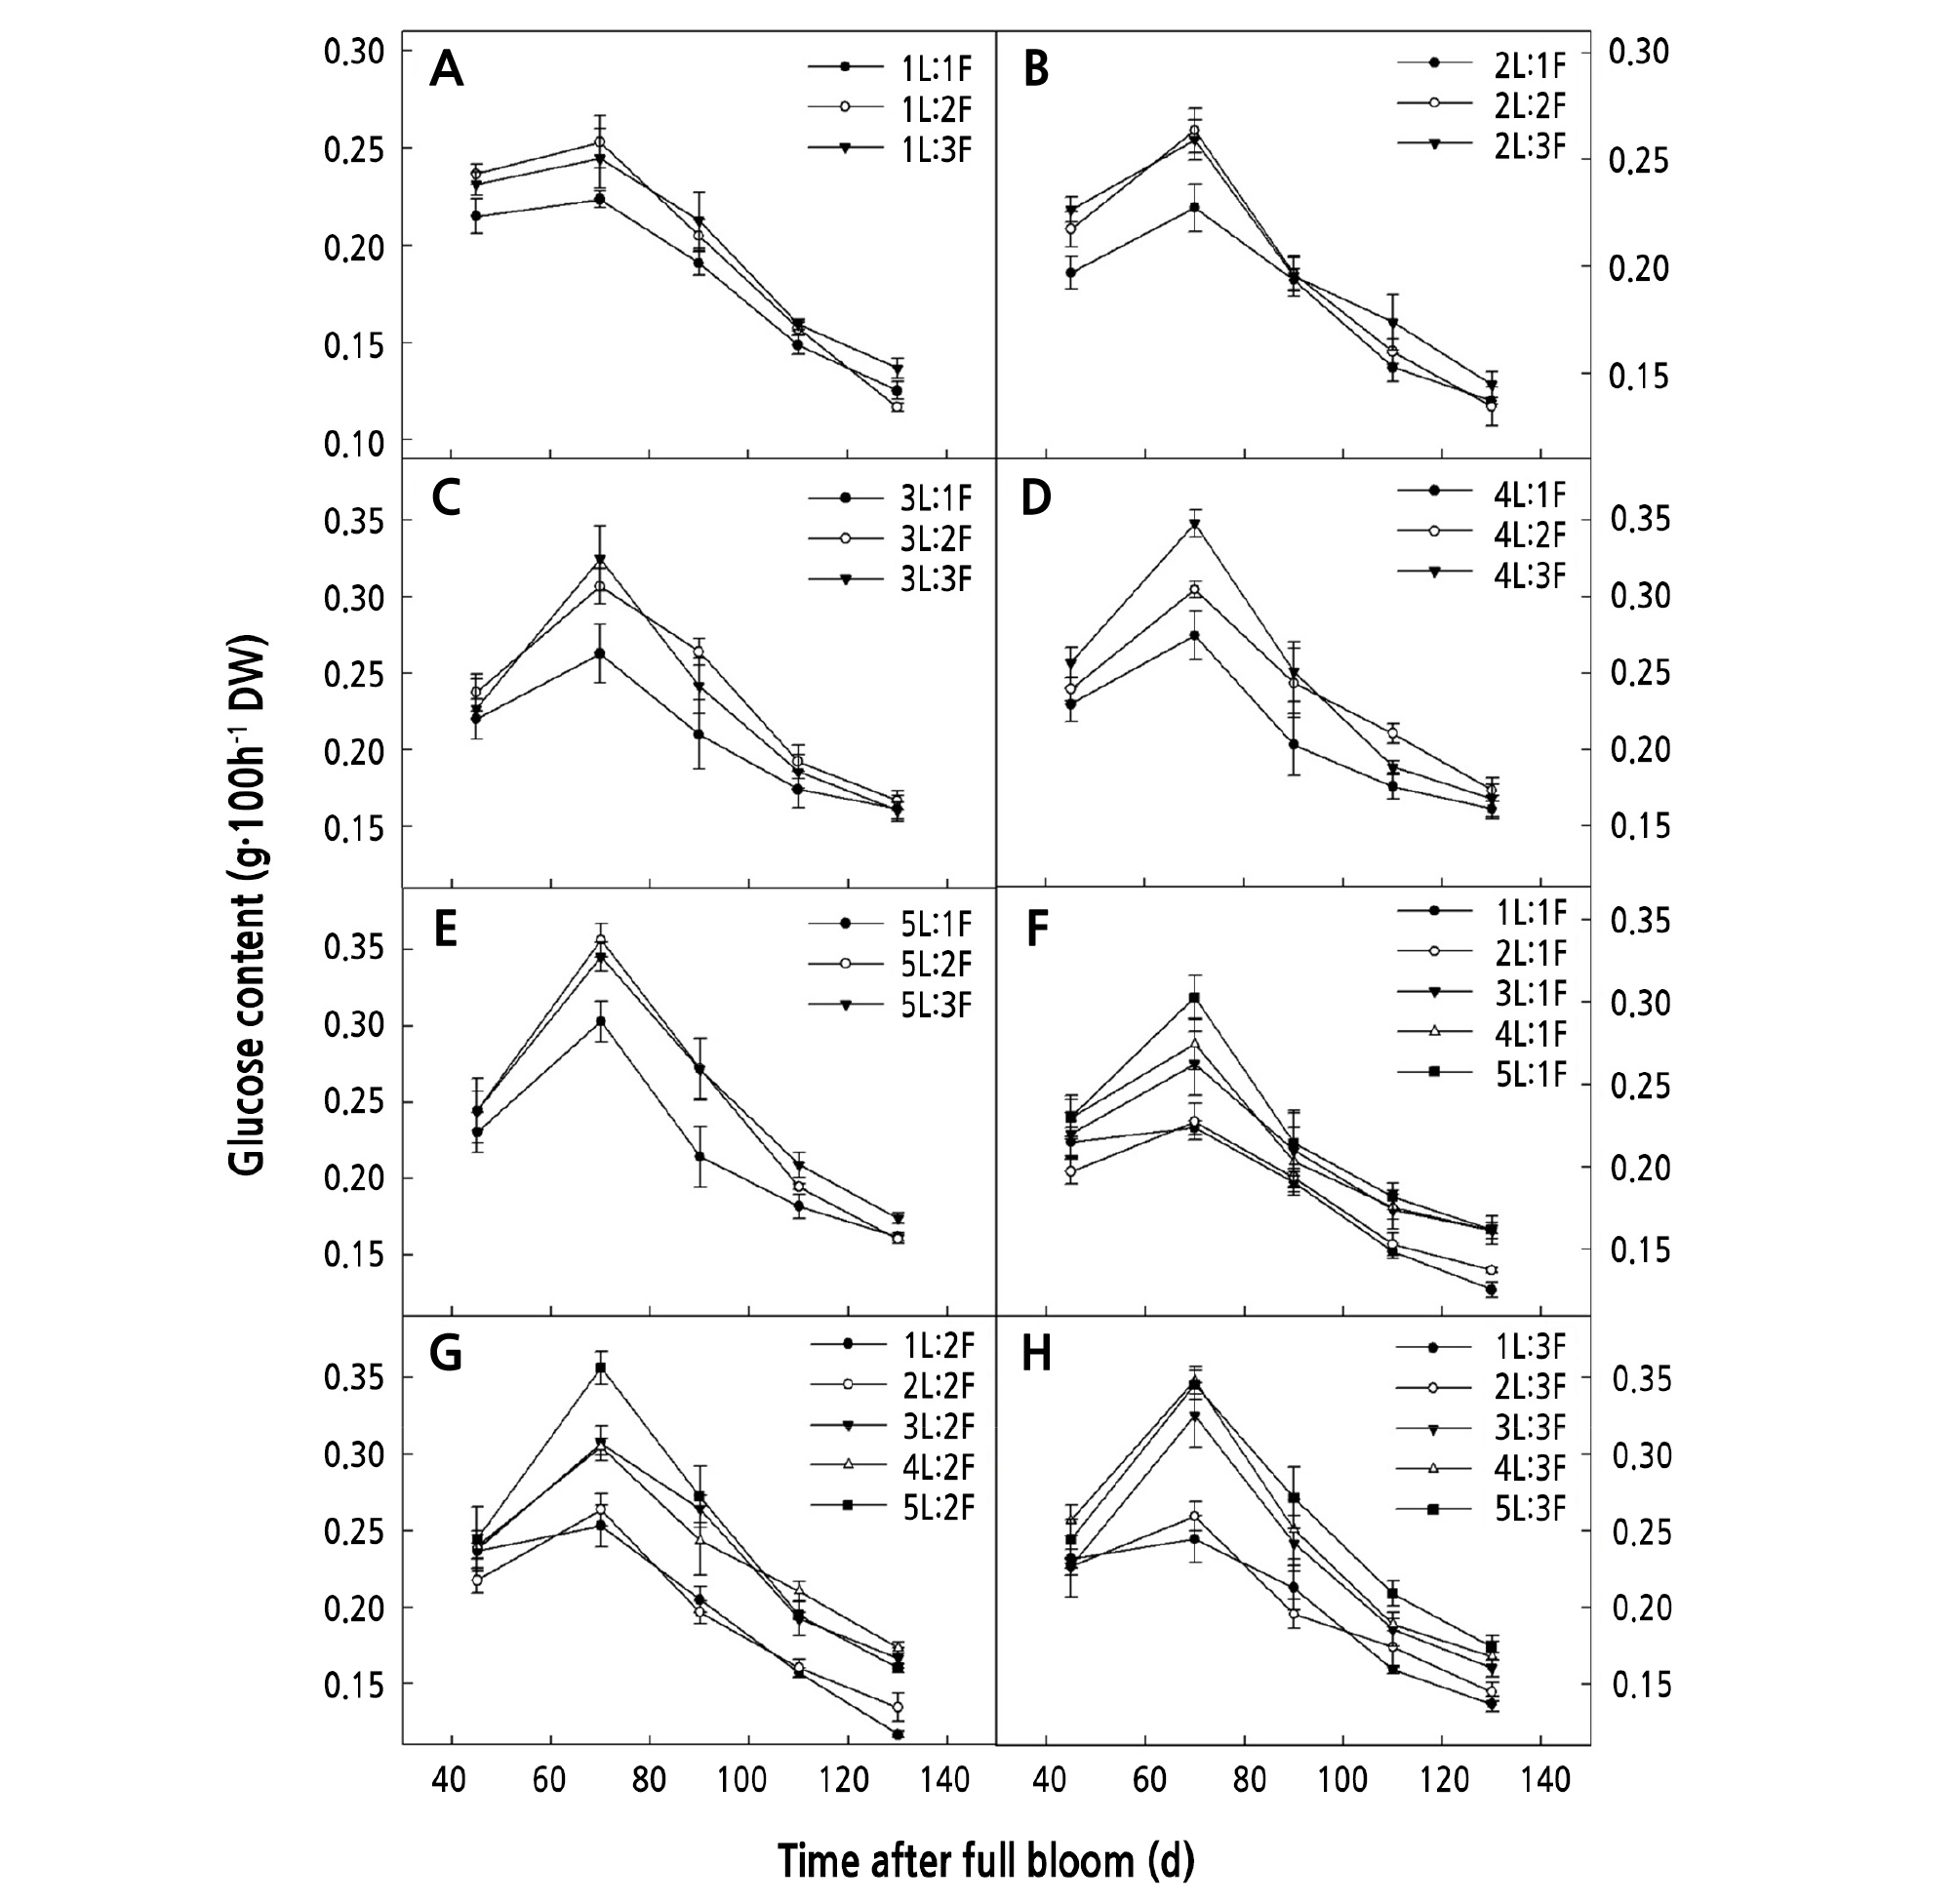
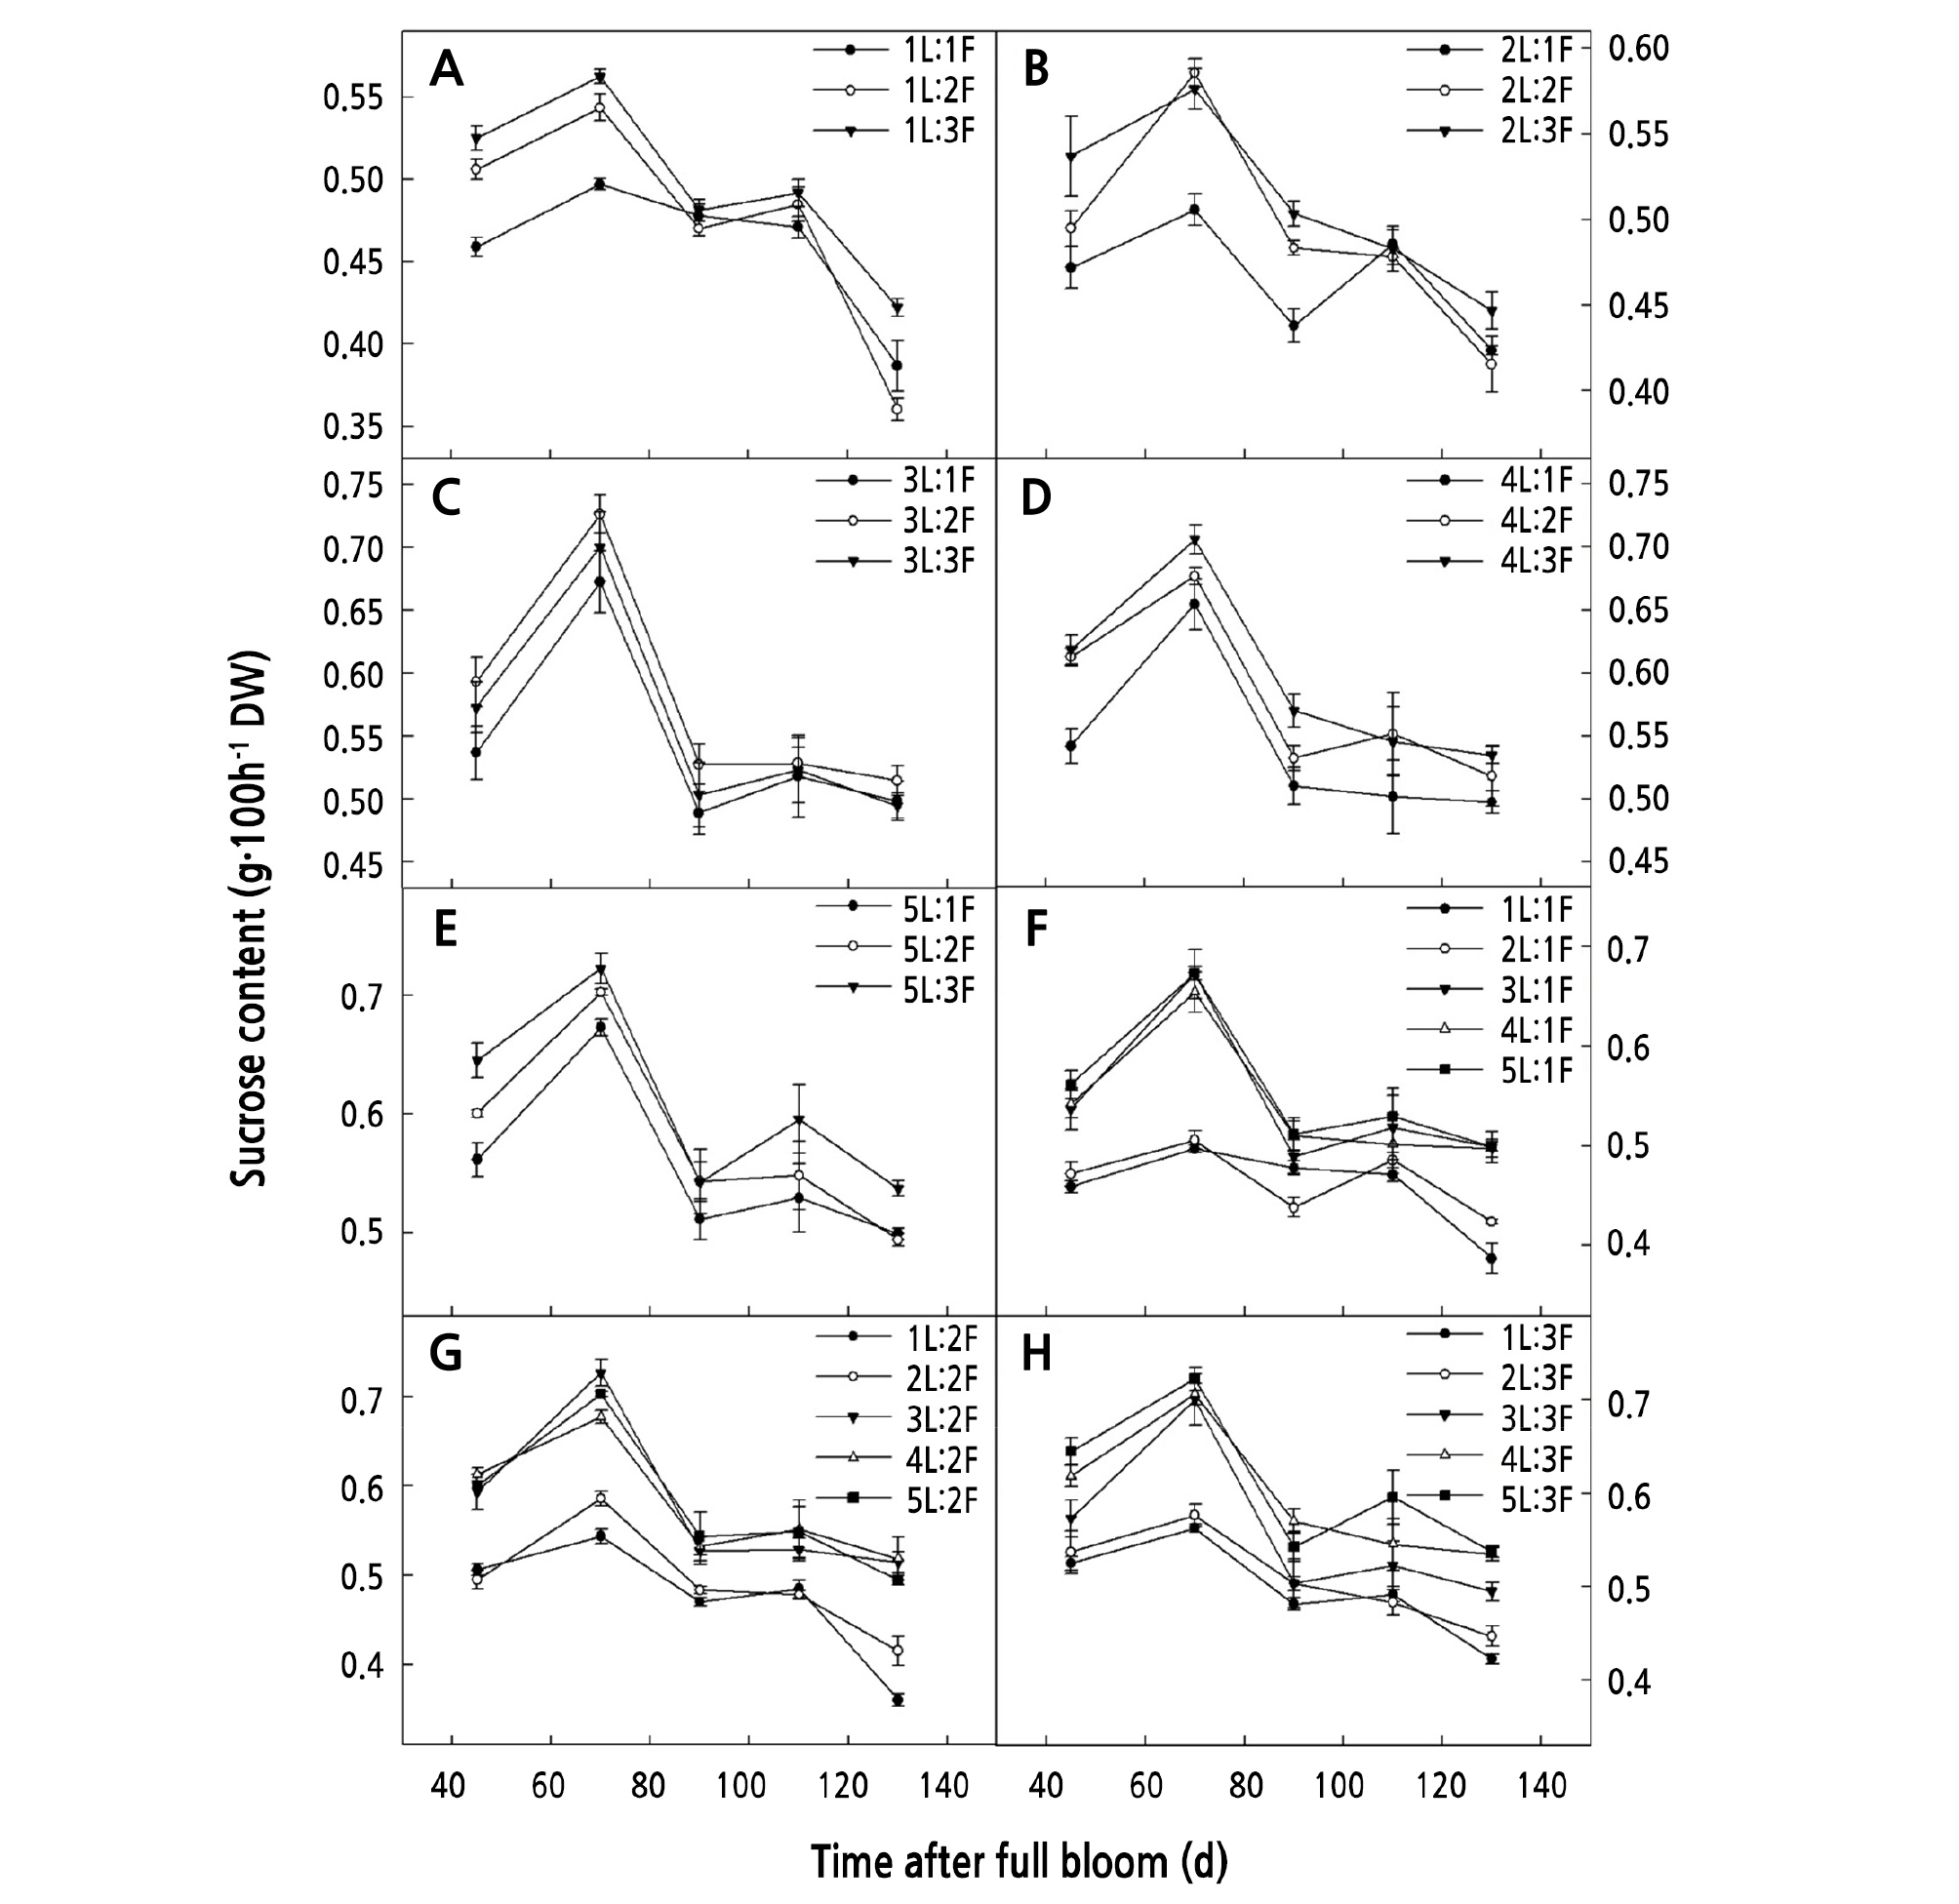
When the same number of fruits was retained on the girdled shoots, the glucose and sucrose content increased gradually with an increase in the number of leaves. The glucose and sucrose content for (4 ‑ 5)L:1F was significantly higher than that for (1 ‑ 2)L:1F (p < 0.05) (Fig. 2F) (Fig. 3F), that for (4 ‑ 5)L:3F was significantly higher than that for (1 ‑ 2)L:2F (p < 0.05) (Fig. 2G) (Fig. 3G), and that for (4 ‑ 5)L:3F was significantly higher than that for (1 ‑ 2)L:3F (p < 0.05) (Fig. 2H) (Fig. 3H).
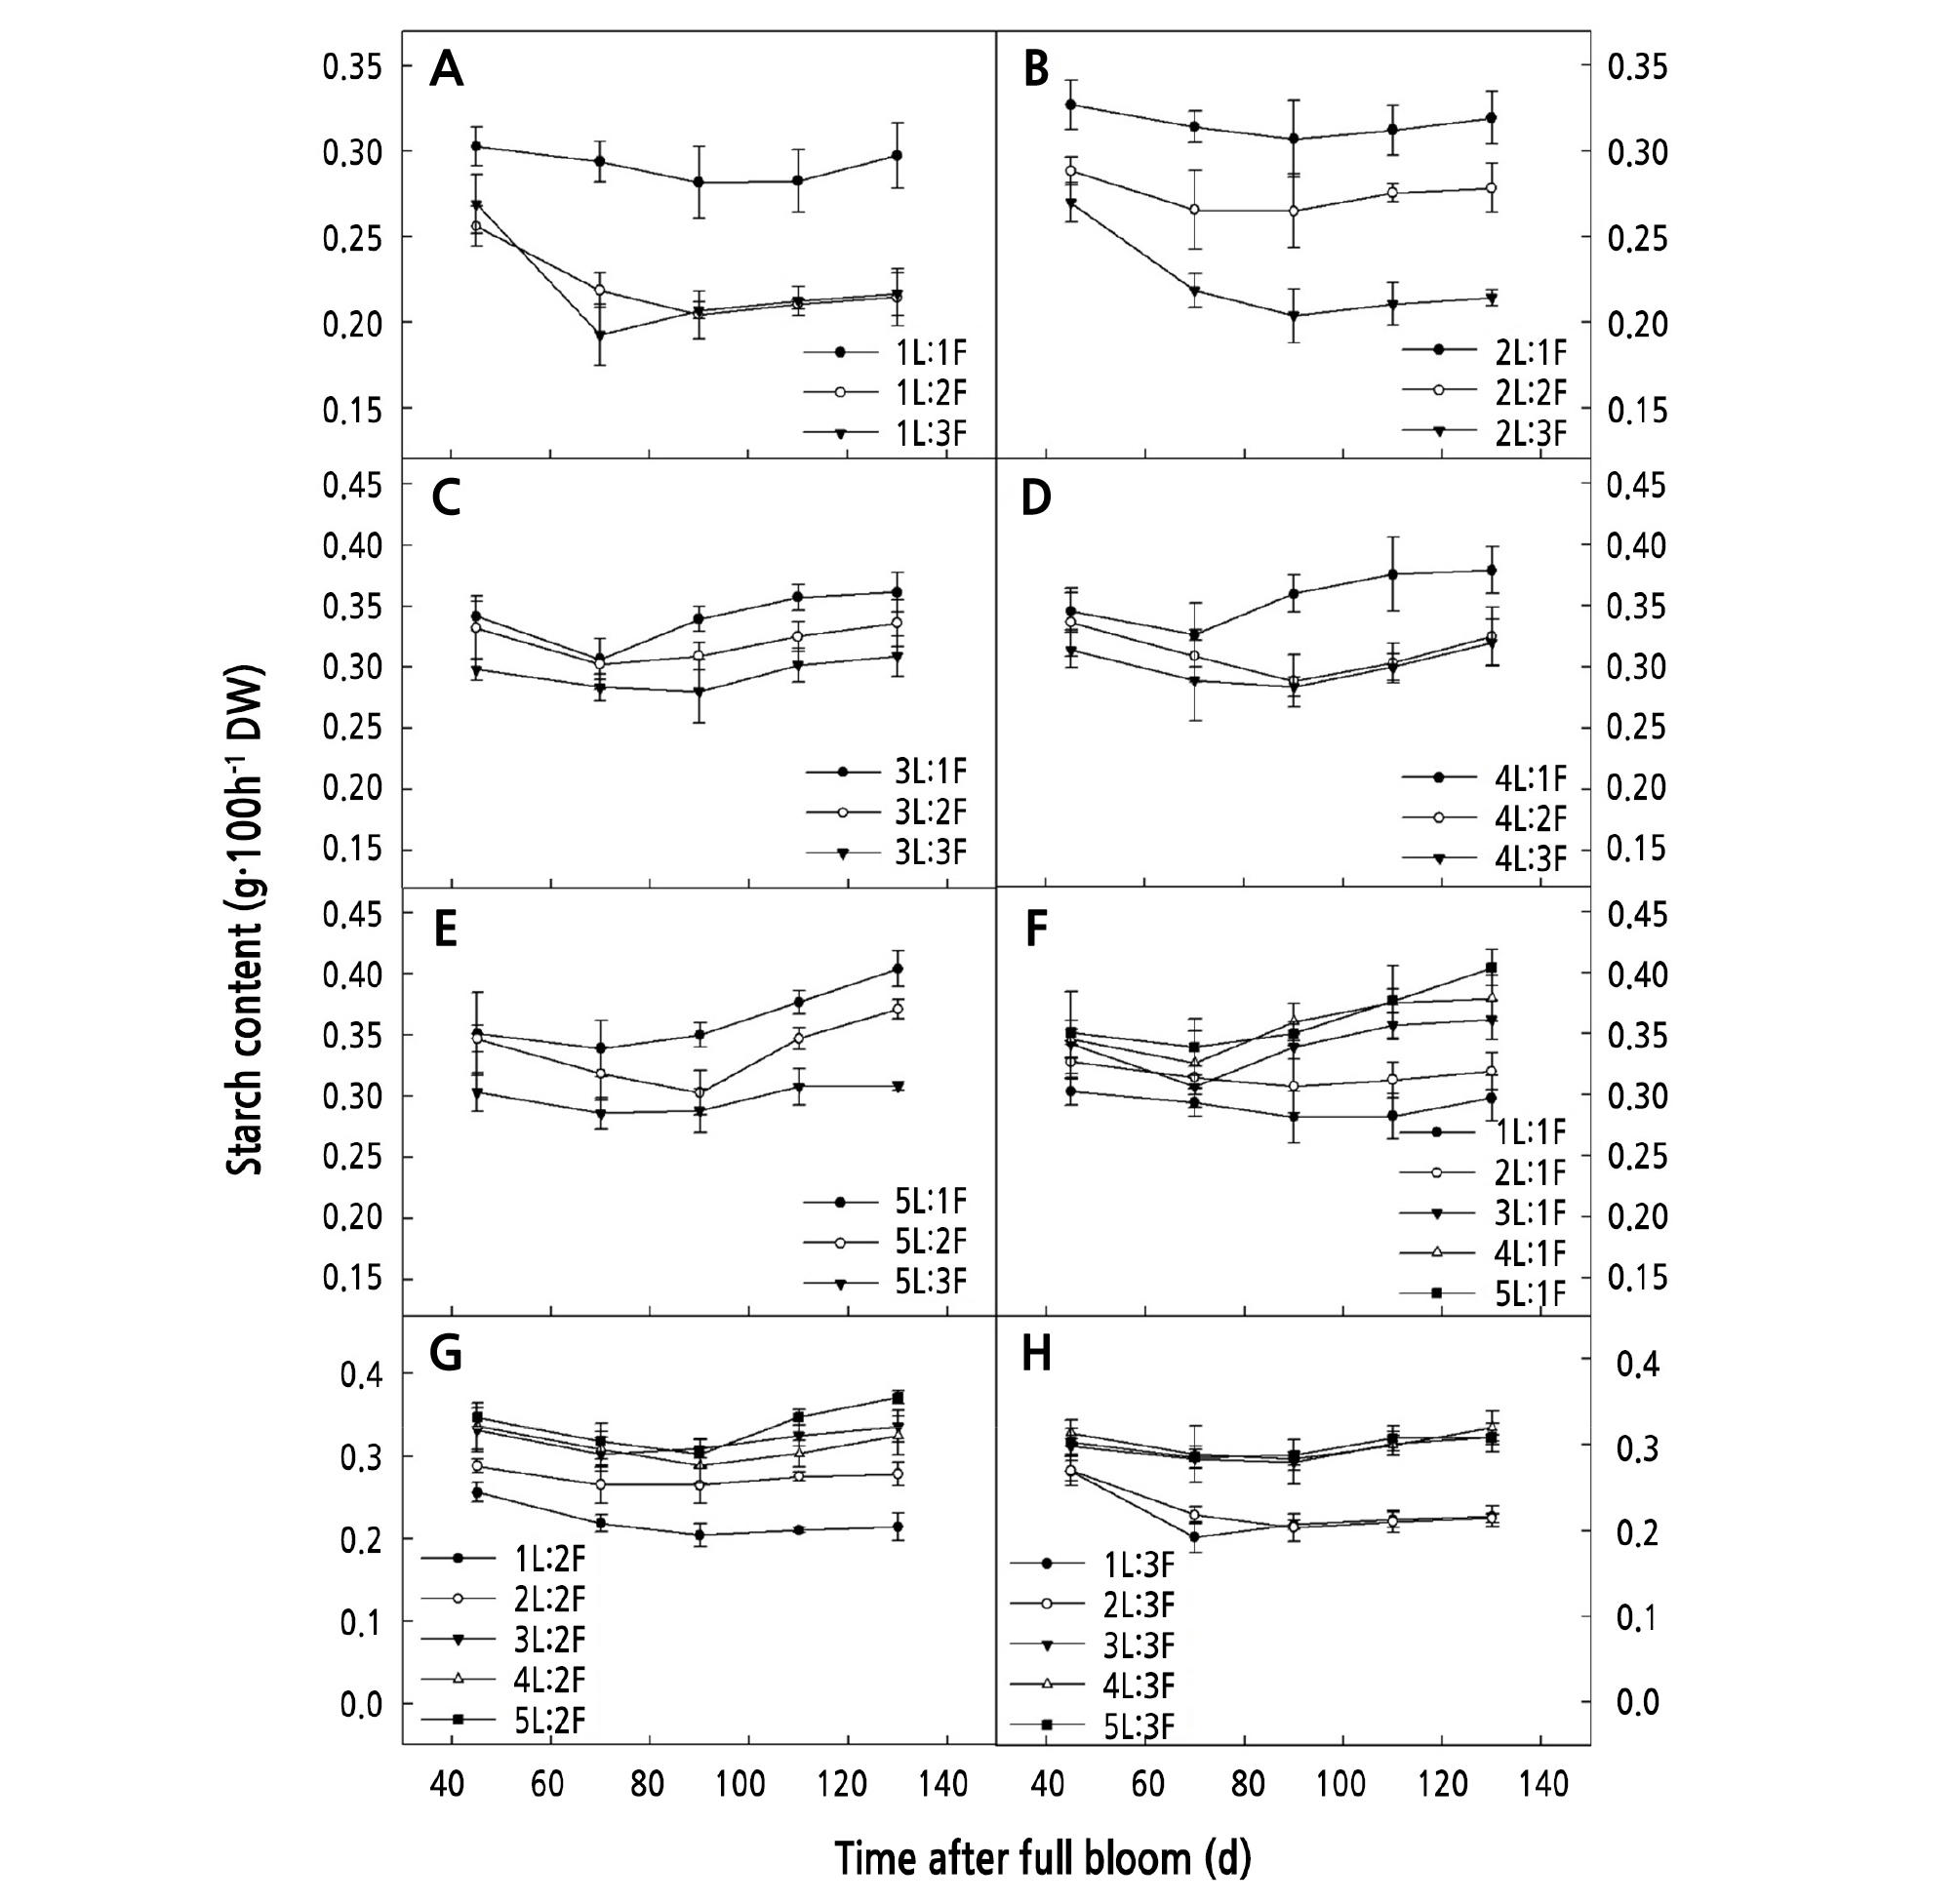
When the same number of leaves was retained on the girdled shoots, the starch content decreased with an increasing number of fruits. That for (1 ‑ 5)L:1F was significantly higher than that for (1 ‑ 5)L:3F (Fig. 4A-4E) (p < 0.05). When the same number of fruits was retained on the girdled shoots, the starch content increased with an increase in the number of leaves. The starch content for (3 ‑ 5)L:1F was significantly higher than that for (1 ‑ 2)L:1F (p < 0.05), that for (3 ‑ 5)L:2F was significantly higher than that for (1 ‑ 2)L:2F (p < 0.05) (Fig. 4G), and that for (3 ‑ 5)L:3F was significantly higher than that for (1 ‑ 2)L:3F (p < 0.05) (Fig. 4H).
Seasonal Variation of the Key Enzyme Activity for Carbohydrate Metabolism in the Carpopodium of Girdled Shoots with Different LFRs
When the same number of leaves was retained on the girdled shoots, AI and SPS activity increased with an increase in the number of fruits. The AI and SPS activity for both (1 ‑ 2)L:2F and (1 ‑ 2)L:3F was significantly higher than that for (1 ‑ 2)L:1F (p < 0.05) (Figs. 5A-5B, and 6A-6B), and that for both (4 ‑ 5)L:2F and (4 ‑ 5)L:3F was significantly higher than that for (4 ‑ 5)L:1F (p < 0.05) (Figs. 5D-5E and 6D-6E).
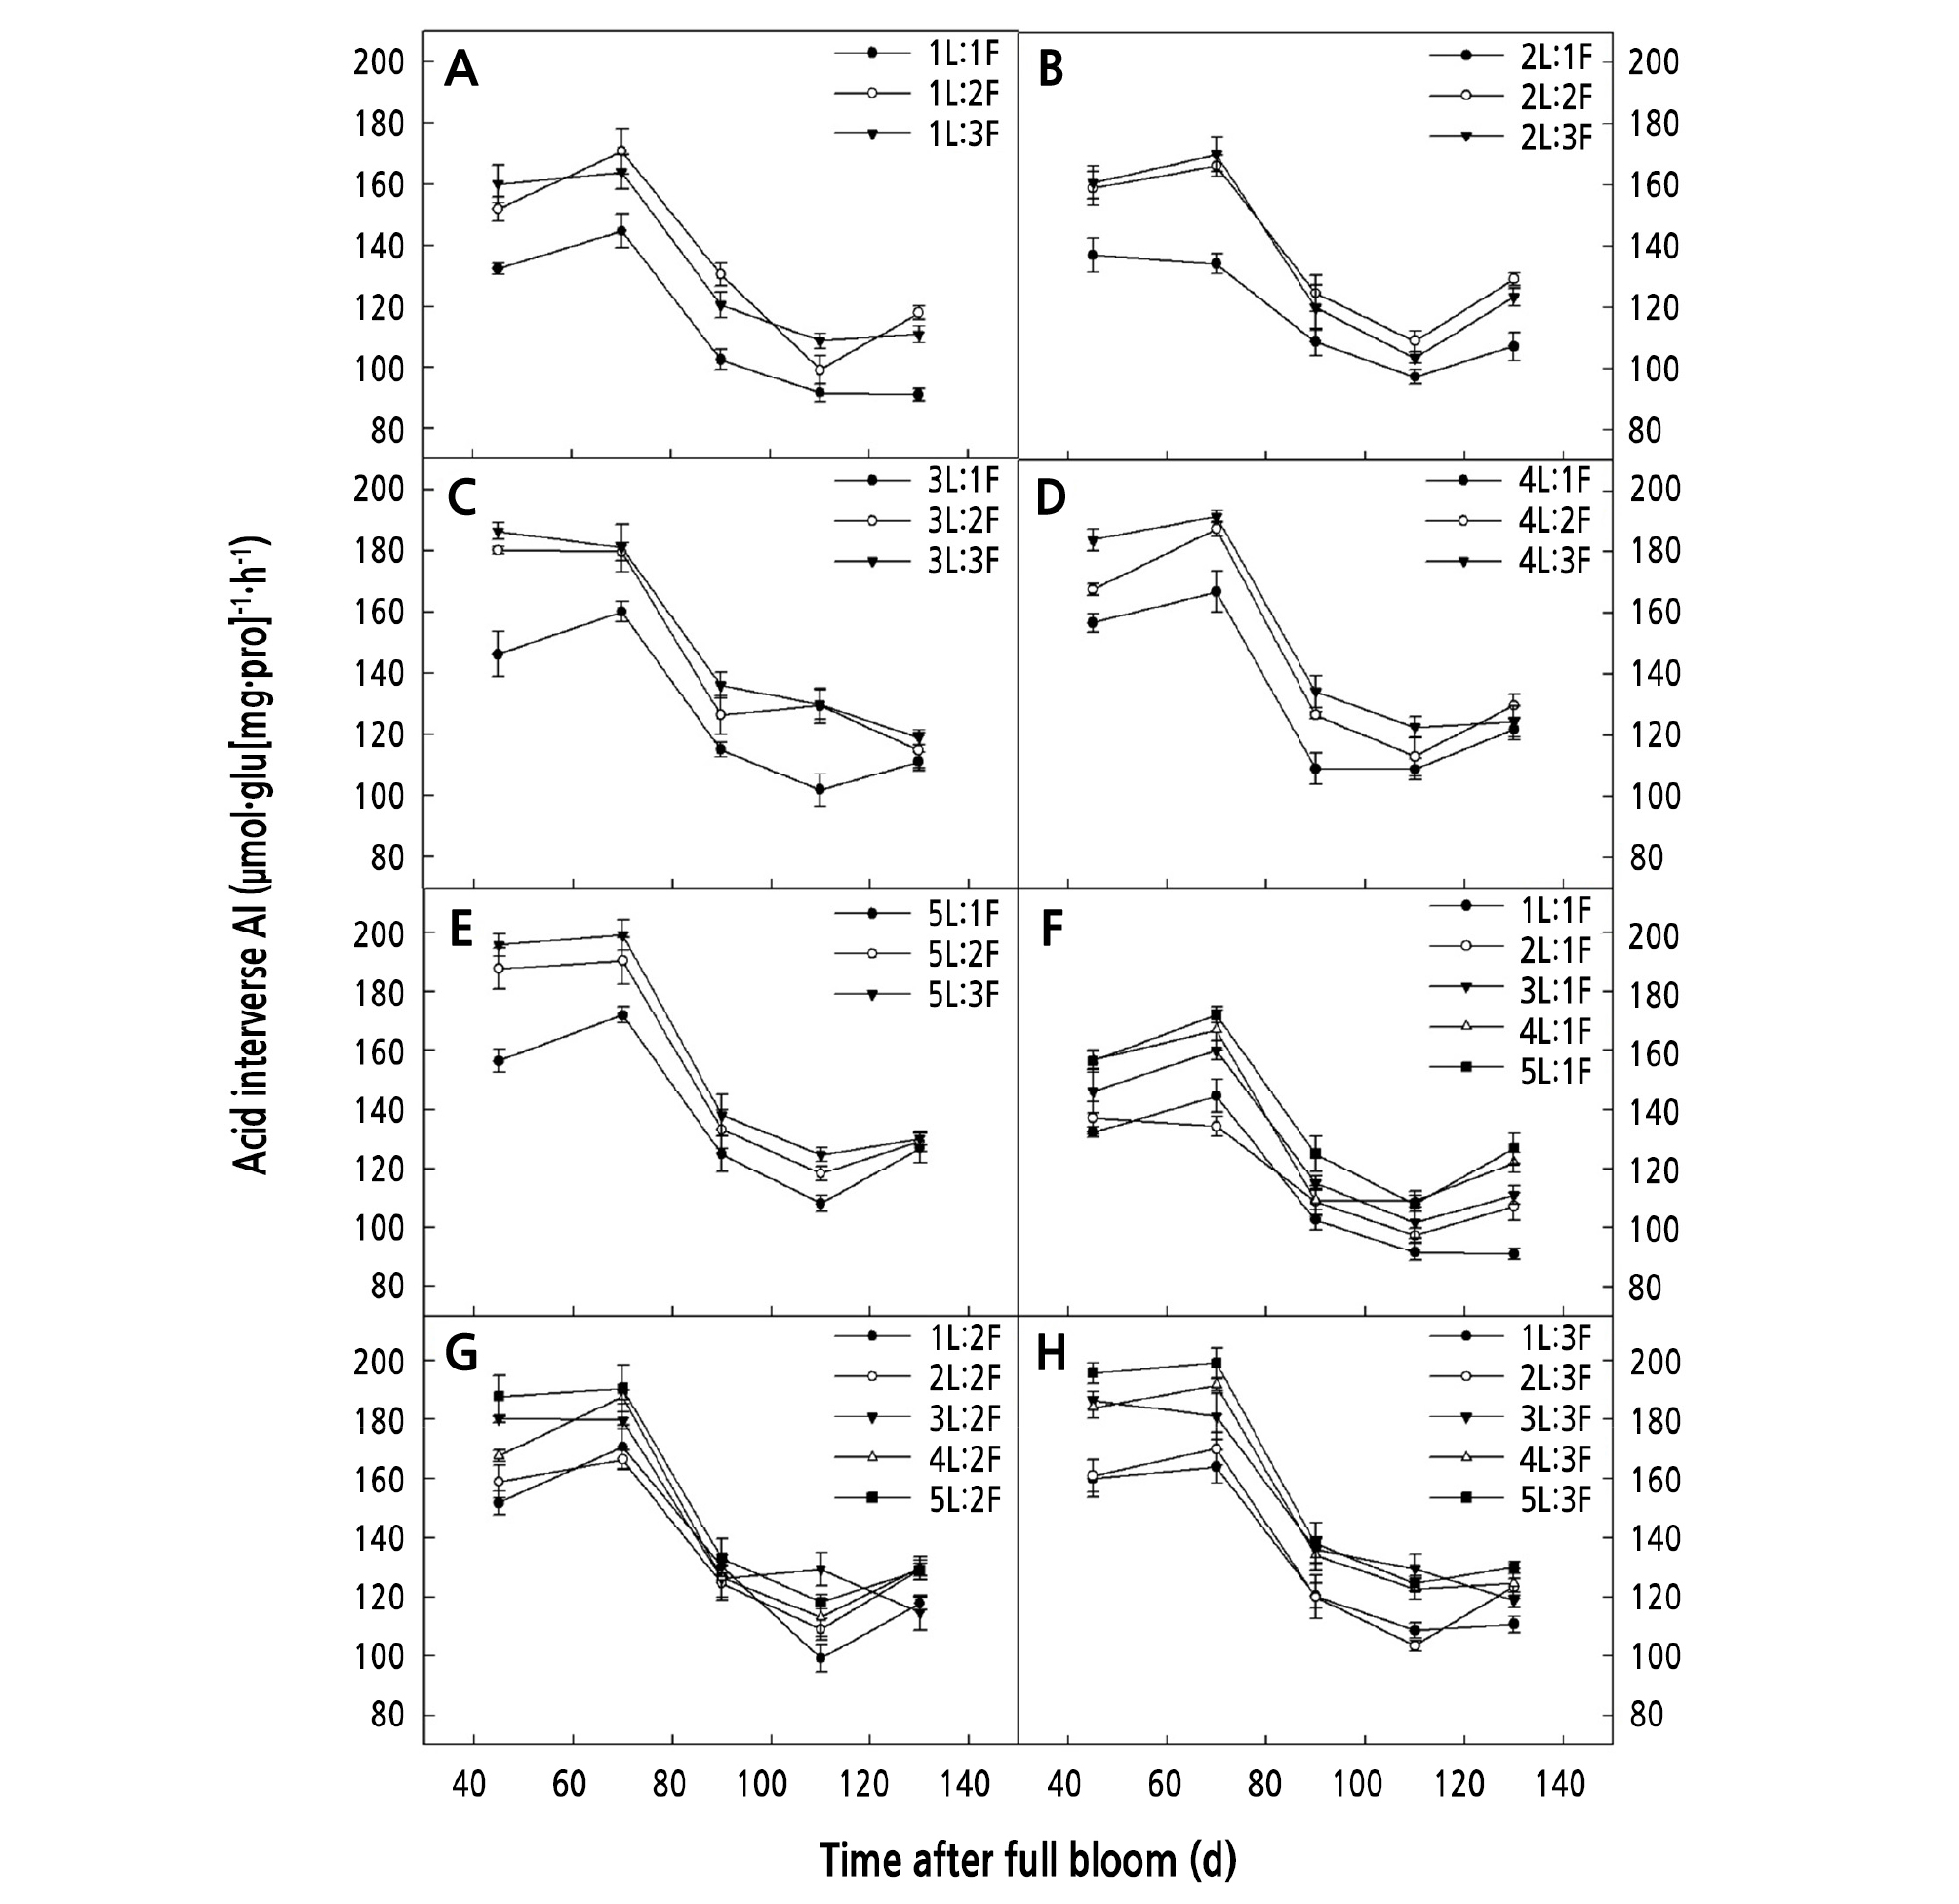
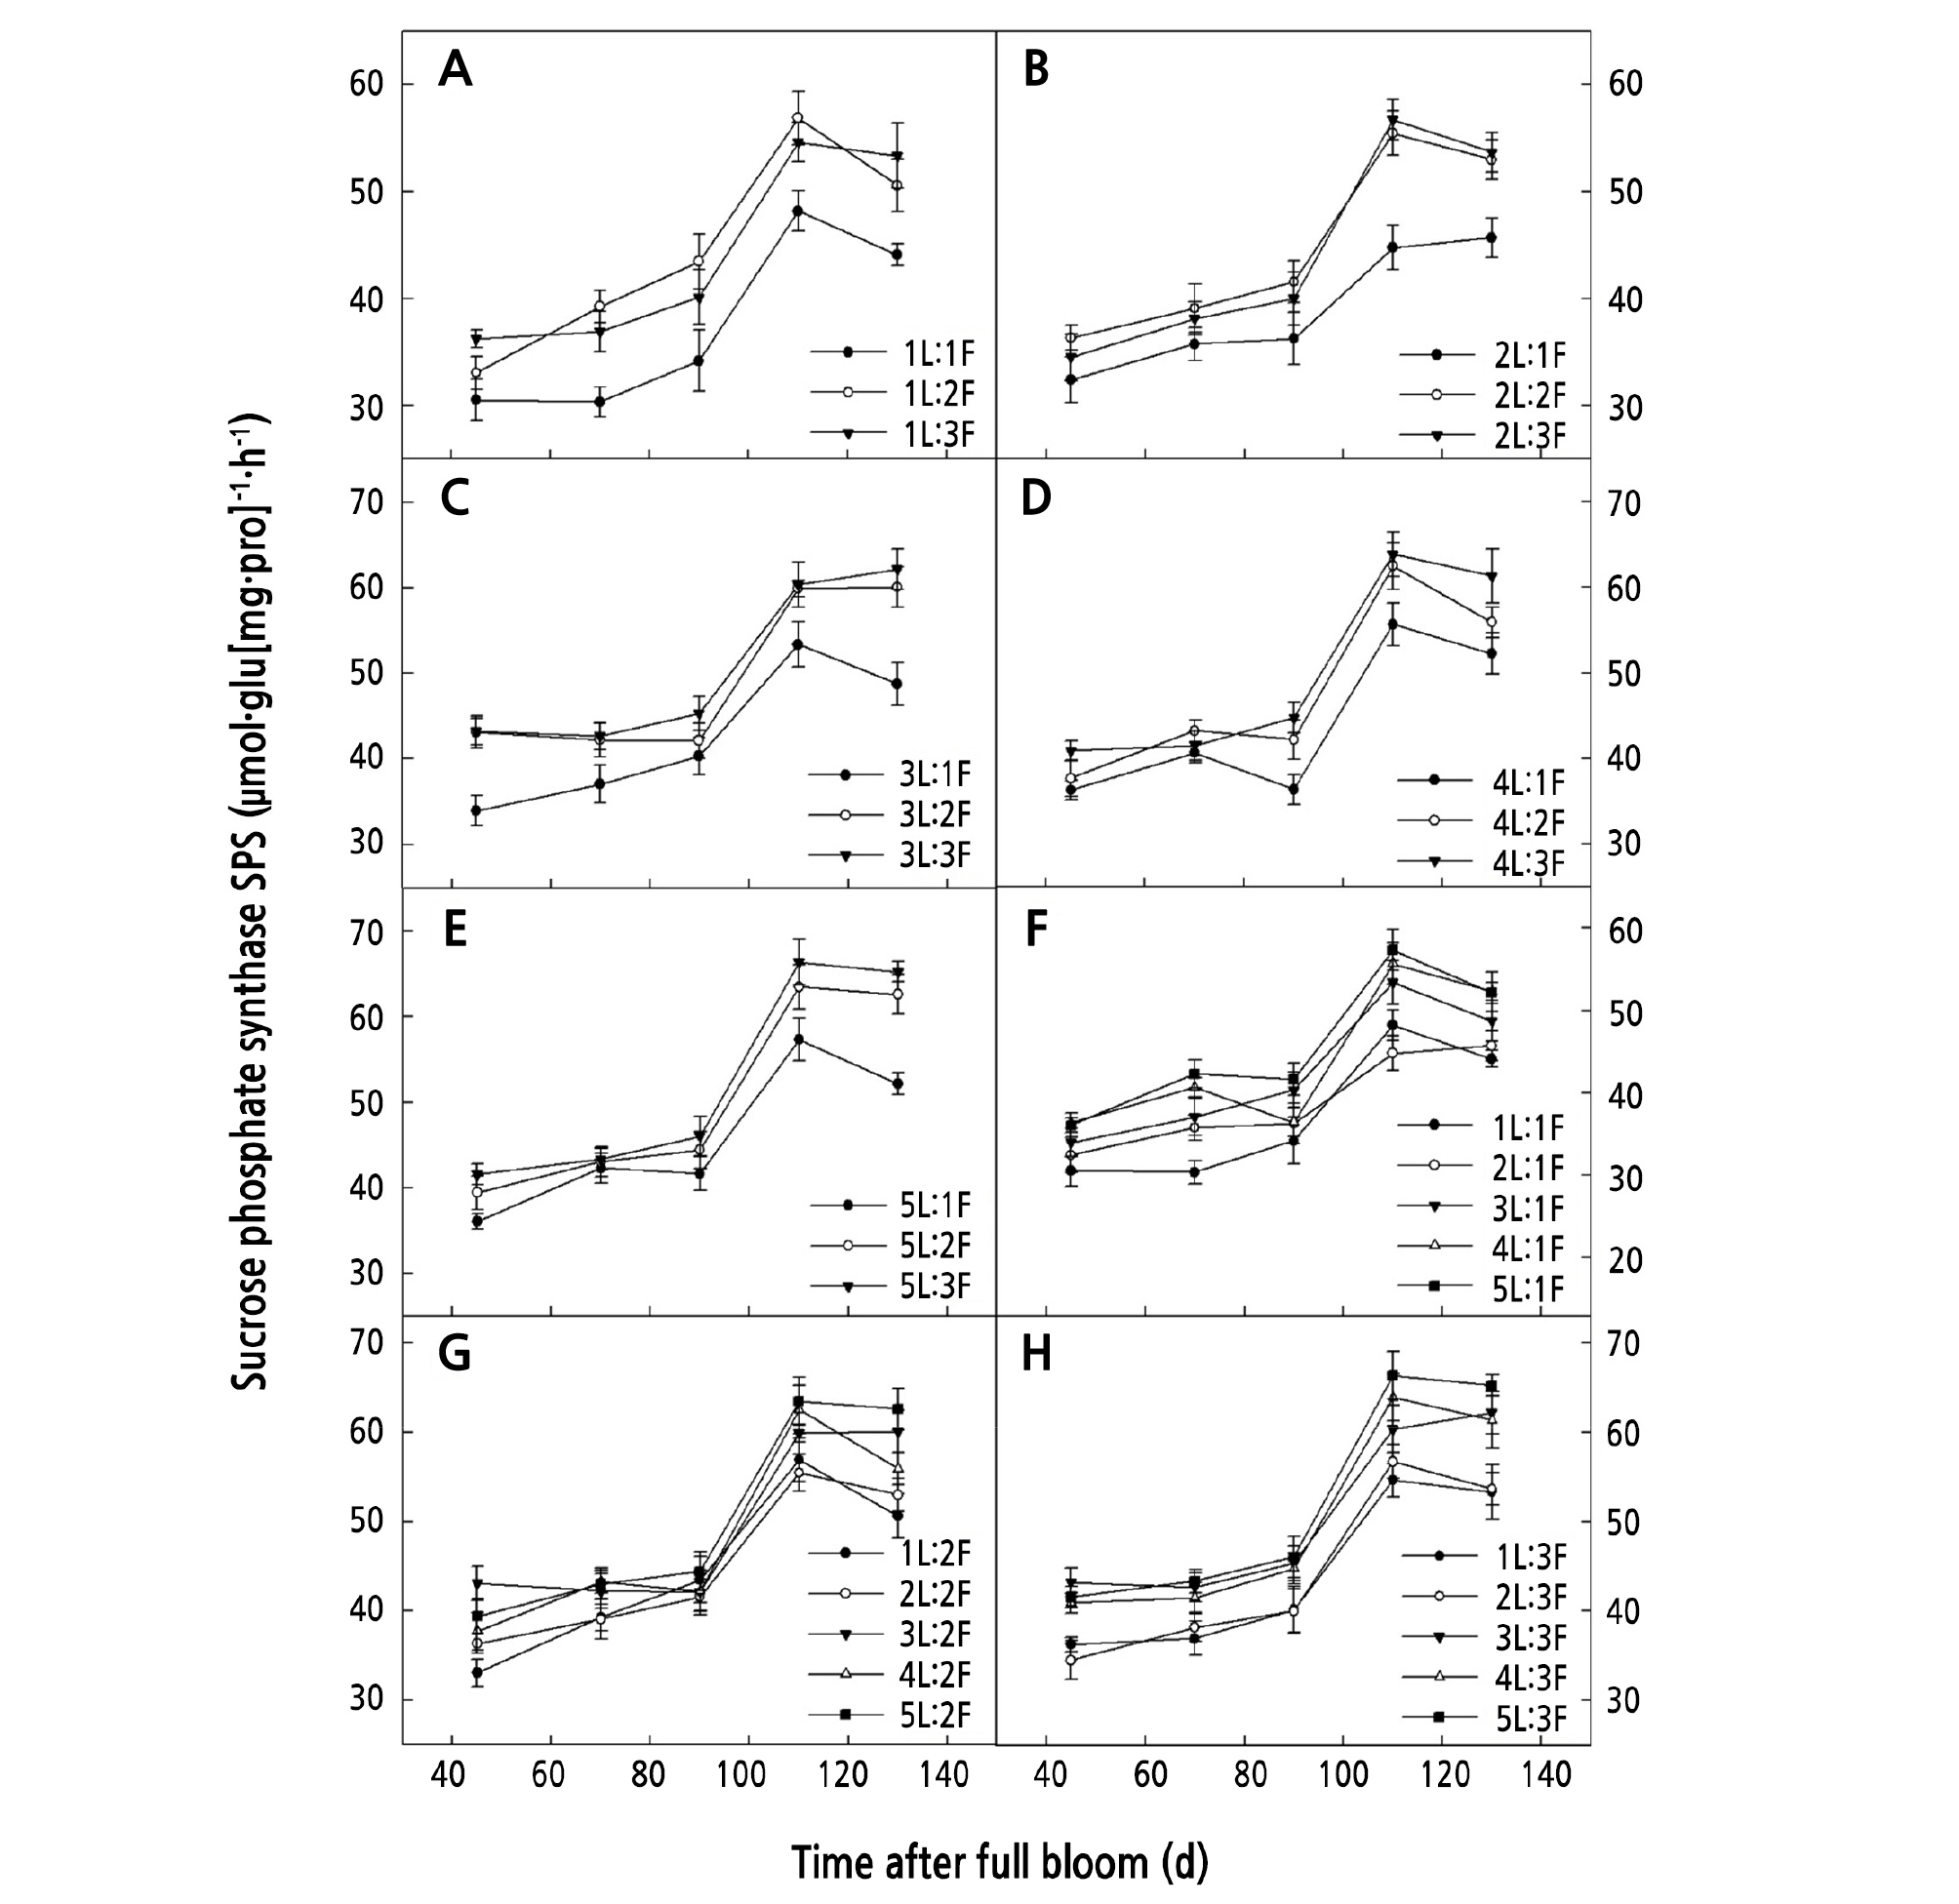
When the same number of fruits was retained on the girdled shoots, the AI and SPS activity increased with an increasing number of leaves. The AI and SPS activity for (4 ‑ 5)L:1F was significantly higher than that for 1L:1F (p < 0.05) (Figs. 5F and 6F), that for 5L:2F was significantly higher than that for 1L:2F (p < 0.05) (Figs. 5G and 6G), and that for (3 ‑ 5)L:3F was significantly higher than that for (1 ‑ 2)L:3F (p < 0.05) (Figs. 5H and 6H).
Variations in the Carpopodium of Girdled Shoots with Different LFRs
The results of the ANOVA (Table 2) indicated that LFR had a significant effect on SMTR, PA, CL, CDGR, and CLGR (p < 0.05).
Table 2.
Analysis of variance of one factor with multiple response variables testing the effect of time and leaf-to-fruit ratio on carpopodium traits
The results of the multiple comparisons (Table 3) indicated that when the same number of leaves was retained on the girdled shoots, SMTR, PA, and CL increased with an increase in the number of fruits. SMTR, PA, and CL for (1 ‑ 5)L:3F were significantly higher than those for (1 ‑ 5)L:1F (p < 0.05). When the same number of fruits was retained on the girdled shoots, there was no significant difference in PA of girdled shoots for different LFRs (p > 0.05); however, SMTR and CL increased with an increasing number of leaves. SMTR for (3 ‑ 5)L:1F was significantly higher than that for (1 ‑ 2)L:1F (p < 0.05), that for 5L:2F was significantly higher than that for 1L:2F (p < 0.05), and that for (4 ‑ 5)L:3F was significantly higher than that for (1 ‑ 2)L:3F (p < 0.05). The CL for (1 ‑ 3)L:2F was significantly lower than that for 5L:2F (p < 0.05).
Table 3.
Multiple comparison of carpopodium traits of girdled shoots with different leaf-to-fruit ratios (LFRs) (means ± SE, n = 10)
yDifferent lowercase letters indicate significant differences at 0.05 level.
When the same number of leaves was retained on the girdled shoots, CDGR and CLGR decreased with the increase in fruit load. CDGR and CLGR for (1 ‑ 5)L:1F were significantly higher than those for (1 ‑ 5)L:(2 ‑ 3)F (p < 0.05). When the same number of fruits was retained on the girdled shoots, CDGR and CLGR increased with an increasing number of leaves. More specifically, CDGR of girdled shoots for (4 ‑ 5)L:1F was significantly higher than that for (1 ‑ 2)L:1F (p < 0.05), that for (4 ‑ 5)L:2F was significantly higher than that for (1 ‑ 3)L:2F (p < 0.05), and that for 5L:3F was significantly higher than that for (1 ‑ 3)L:3F (p < 0.05). CLGR for (4 ‑ 5)L:(1 ‑ 3)F was significantly higher than that for (1 ‑ 3)L:(1 ‑ 3)F (p < 0.05).
Correlation Analysis of Multiple Dependent Variables for Walnut Carpopodiums Significantly Affected by the LFR
The correlation analysis (Table 4) revealed that when the same number of fruits was retained on the girdled shoots, LFR was highly significantly positively correlated with the contents of glucose, sucrose, starch, AI and SPS activity, SMTR, and CLGR (p < 0.01); LFR was significantly correlated with CDGR (p < 0.05); and LFR was not significantly correlated with PA and CL (p > 0.05).
Table 4.
Matrix of correlation coefficients among the response variables that are significantly affected by leaf-to-fruit ratio (LFR) in walnut carpopodium
y** represents the correlation is extremely significant at the 0.01 level.
x* represents the correlation is extremely significant at the 0.05 level.
When the same number of leaves was retained on the girdled shoots, LFR was highly significantly negatively correlated with AI and SPS activity, SMTR, and PA (p < 0.01); LFR was significantly correlated with the glucose content (p < 0.05); but LFR was not significantly correlated with sucrose and starch content, CDGR, and CLGR (p > 0.05).
SMTR was highly significantly positively correlated with glucose and sucrose content, AI and SPS activity, PA, and CL (p < 0.01), whereas SMTR was not significantly correlated with starch content, CDGR, and CLGR (p > 0.05).
Discussion
This study revealed significant differences in the carpopodium SMTR (p < 0.05) of girdled shoots with different LFRs, which indicated that changes to the LFR had an effect on the carbohydrate translocation between the sources and sinks. When a certain number of leaves was retained on the girdled shoots, the carpopodium of the girdled shoots with higher loading (lower LFRs) showed higher carbohydrate SMTR, glucose and sucrose contents, and AI activity. This was because sucrose was the major form of the carbohydrates translocated in the walnut carpopodium (Farrar et al., 2000). Upon entering the carpopodium, sucrose was broken down into fructose and glucose, which in turn were transformed into starch and accumulated in the carpopodium. The decomposition of sucrose into glucose and fructose reduced the concentration of sucrose in the carpopodium and facilitated the translocation of sucrose to sink fruits by increasing the concentration gradient of sucrose between the sources and sinks (de Wald et al., 1994; van Bel, 2003). Under the conditions of a low LFR and high loading, there was an intense competition for carbohydrates among multiple fruits due to the limited supply of carbohydrates from the sources, resulting in much lower sucrose concentrations at the sinks. To meet the carbohydrate needs of multiple fruits, the carpopodium increased the AI activity to speed up sucrose decomposition to increase the transfer rate of sucrose to the sinks, which could also be reflected by the higher glucose content in the carpopodium of girdled shoots with higher loading (Fig. 2). We also found that the net photosynthetic rate (Pn) in the leaves (Zhang et al., 2019) and the SMTR of the carpopodium on girdled shoots with 5L:3F were high, but the girdled shoots with LFRs of 1L:3F, 2L:3F, 3L:3F, and 4L:3F had relatively high carpopodium SMTR and relatively low leaf Pn (Zhang et al., 2019), which suggests that the transfer rate of carbohydrates in the carpopodium depended not only on the assimilative capacity of carbohydrates in the leaves, but also on its output capacity. Studies have shown that the carbohydrates produced by walnut leaves from photosynthesis are divided into three parts: One is used for its own growth needs, another is stored temporarily in the leaves as starch, and another is transported to other sink organs (David, 1985). Moscatello et al. (2017) suggested that ungirdled young walnut trees export 90% of their own carbohydrates to storage tissues, including vegetative branches, stems, and roots for storage and accumulation. Therefore, it could be inferred from the results of this study that, under the condition of high loading and low LFRs (1L:3F, 2L:3F, 3L:3F, and 4L:3F), when there was a limited amount of available carbohydrates in the girdled shoots, the leaves would export most of the carbohydrates produced from photosynthesis to sink fruits, thereby affecting their own growth. These findings also explain the observed lower SLW and leaf thickness on girdled shoots with higher loading and lower LFRs (1L:3F, 2L:3F, 3L:3F, and 4L:3F) (Zhang et al., 2019). In this study, although the carpopodium of girdled shoots with higher loading maintained a higher level of PA and CL, the CDGR and CLGR of girdled shoots were significantly lower. These findings indicated that prior to girdling, shoots with higher loading showed higher initial values of PA and CL; however, after girdling, more carbohydrates produced by the leaves from photosynthesis were allocated to more fruits, which led to a low amount of carbohydrates allocated to the carpopodium. Hence, in the carpopodium, the carbohydrates for storage (as starch) and growth were also limited, which would ultimately exert negative effects on CDGR and CLGR.
Our results also showed that when a certain number of fruits were retained on the girdled shoots, the carbohydrate SMTR of the carpopodium increased with an increasing number of leaves. It is likely that as the number of leaves increased, the content of available carbohydrates also increased. After a high concentration of sucrose from the sources was translocated to the carpopodium, the sucrose decomposition was accelerated by enhancing the AI activity, the water potential of the carpopodium increased, and the swelling pressure decreased, so as to ensure the downward transportation of sucrose, which was in agreement with the findings for sugar beet (Zhou, 2008). Simply, carpopodium SMTR was shown to be dependent on the availability of carbohydrates. Similar to another report (Famiani et al., 2000), we also found that the LFR could alter the carpopodium traits of girdled shoots, which was because the carpopodium of girdled shoots with higher LFRs could detect and respond to the excess carbohydrates; for example, the carpopodium starch content, CDGR, and CLGR all increased significantly. These results indicated that girdling prevented the exchange of carbohydrates between girdled shoots and other parts of the tree. When carbohydrate availability from photosynthesis was low, most of the carbohydrates were allocated to the fruits, and only when there was a surplus of carbohydrates did the carbohydrate concentration increase significantly in the storage tissues of the shoots.
Conclusions
The LFR changes in walnut trees had an effect on the carbohydrate translocation between the sources and sinks. There was limited carbohydrate availability from the sources under the conditions of higher loading or lower LFRs, which accelerated the decomposition of sucrose by enhancing AI activity in the carpopodium and then promoted carbohydrate transportation to the fruits. However, due to the lower availability of carbohydrates, the amount of carbohydrates allocated to the carpopodium was lower, which led to negative effects on carpopodium growth. Under the conditions of lower loading or higher LFRs, there was higher carbohydrate availability at the sources, which allocated surplus carbohydrates to the carpopodium, thereby promoting their growth.
