

Introduction
Materials and Methods
Plant Materials and Growth Conditions
Treatments
Measurement of Plant Growth Parameters
Determination of Individual Glucosinolate Concentrations in Leaves and Stems of Watercress
Statistical Analysis
Results and Discussion
Plant Growth and Yield
Total Glucosinolate Concentration and Content
Conclusions
Introduction
Watercress (Nasturtium officinale L.; Brassicaceae) is an aquatic perennial plant that is native to India, Africa, Europe, and Western Asia (Zeb, 2015) and is usually found growing in low streams, brooks, and ditches, as well as along pond margins (Aires et al., 2013). Watercress was selected as a crop with the highest nutrient content per calorie by the US Centers for Disease Control and Prevention (CDC) (Noia, 2014). The watercress plant contains a variety of phytochemicals, including quercetin, lutein, β-carotene, phenolic acids, and glucosinolates (Aires et al., 2013; Jeon et al., 2017). Multiple studies have reported that watercress’ bioactive compounds, antioxidant capacity, and nutritional content can enhance immunity and health (Rodrigues et al., 2016), prevent cancer (Fallah and Ebrahimi, 2016), and reduce lymphocyte DNA damage (Gill et al., 2007). Glucosinolates from watercress can increase blood antioxidant levels (Zeb, 2015). The high content of glucosinolates in watercress can also decrease the risk of colorectal cancer (Pereira et al., 2017), lung cancer (Moy et al., 2009), and breast cancer (Fowke et al., 2003). Finally, watercress glucosinolates are beneficial to the immune system (Asadi et al., 2012). Therefore, it is believed that the industrial application value of watercress is high.
Many studies have reported that agronomic factors (e.g., soil types, fertilizers, pesticides, cultivation methods, and habitat manipulations) and environmental conditions (e.g., season, light, temperature, water, humidity, CO2, and nutrition) can affect the content of phytochemicals in vegetables, such as glucosinolates in members of the Brassicaceae (Björkman et al., 2011; Lee et al., 2017; Choi et al., 2018), phenolics, flavonoids, and other bioactive compounds in broccoli (Pek et al., 2013), phenolics in cauliflower (Kaluzewicz et al., 2017), and gluconasturtiin in watercress (Engelen-Eigles et al., 2006). Moreover, the glucosinolate content in Chinese cabbage can maximize under the optimize growth conditions such as temperature, relative humidity, nutrient solution, photoperiod (Shim et al., 2018). Among agronomic factors, optimal plant spacing is an important factor to improve light interception and nutrient absorption, increase production and quality, and provide equal opportunity for plant growth. Spacing also plays an important role in minimizing competition among plants (Papadopoulos and Pararajasingham, 1997; Badi et al., 2004; Jiang et al., 2013). Moreover, the accumulation of important phytochemicals can be improved by controlling plant spacing (Machado et al., 2018). Several studies have shown that optimal plant spacing has positive effects on growth and phytochemical content (Kaluzewicz et al., 2017; Machado et al., 2018). For example, an increase in the density of cauliflower plants gradually increased levels of flavonols and phenolic acids because of the competition among plants, which lead to an overall decrease in the availability of nutrients, light, and water (Kaluzewicz et al., 2017). Decreasing the density of stevia plants increased plant growth, whereas increasing density increased levels of steviol glycoside due to light and nutrient competition (Benhmimou et al., 2017). Similarly, high plant density was associated with maximum yield and oil content in thyme plants because of light and nutrient competition (Badi et al., 2004). Finally, essential oil content in peppermint was significantly increased when plant density was increased from 8 plants/m2 to 20 plants/m2, again due to competition for nutrients and light (Mansoori, 2014).
When deprived of N, many plants increase the production of carbon-based secondary compounds (Bryant et al., 1983; Barbet-Massin et al., 2015). The carbon-nutrient-balance hypothesis (Bryant et al., 1983; Herms and Mattson, 1992) postulates a tradeoff between primary and secondary metabolism. According to this hypothesis, plants prefer to distribute carbohydrates for growth; therefore, additional carbon is shunted into carbon-based secondary compounds under nutrient deficiency (Herms and Mattson, 1992). Environmental conditions (e.g., low nutrient availability and high inorganic carbon availability) can lead to a high C/N ratio, a condition which favors production of carbon-based secondary compounds (Cronin and Hay, 1996). In addition, plant spacing affects light interception by the plant canopy. Light is a crucial factor that affects plant growth, yield, and the production of phytochemicals (Coelho et al., 2007; Hou et al., 2010; Kaluzewicz et al., 2017; Rachmawati et al., 2017). Low light intensity have been shown to increase methylxanthine content in ilex paraguariensis A. St. Hil (Coelho et al., 2007), secondary metabolite content in Glycyrrhiza uralensis Fisch (Hou et al., 2010), and steviol glycoside levels in stevia (Rachmawati et al., 2017). However, low plant density was reported to maximize proline and phenol content and antioxidant activity (FRAP and DPPH) of spinach grown under a hydroponic culture system (Machado et al., 2018), and to increase plant growth, yield, and oil content of thyme plants (Shalaby and Razin, 2008). Therefore, plant spacing may lead to nutrient, light, and water stress, thereby enhancing reactive oxygen species (ROS) production and subsequent production of glucosinolates in watercress (Kaluzewicz et al., 2017; Benhmimou et al., 2017; Machado et al., 2018). Harvesting time is another important factor affecting glucosinolate accumulation in plants (Brown et al., 2003; Moreira-Rodriguez et al., 2017). Glucosinolate accumulation in Arabidopsis thaliana and broccoli were shown to vary at different harvest stages (Brown et al., 2003; Moreira-Rodriguez et al., 2017). Furthermore, harvesting times were affected by different environmental conditions and plant growth stages. Therefore, harvest time may enhance plant growth and quality due to optimal absorption and translocation of nutrients.
To date, several studies have investigated the effects of plant spacing on the levels of secondary metabolites (Nurzynska-Wierdak and Zawislak, 2014; Benhmimou et al., 2017; Machado et al., 2018). However, the effects of plant spacing on the glucosinolate content of watercress grown under a deep-flow technique and greenhouse-based hydroponic culture system have yet to be reported. We therefore sought to determine optimal plant spacing for enhancing plant growth, yield, and glucosinolate content in watercress grown under different plant spacing regimes at different harvesting times.
Materials and Methods
Plant Materials and Growth Conditions
Watercress seeds (Danong Seed Co., Ltd., Seoul, Korea) were sown in a crushed rockwool media tray (60 × 40 cm, 240 holes; UR rockwool, Suwon, Korea), kept in the dark for 1 day, and then moved to a germination room, where the air temperature was maintained at 22 ± 1°C and 18 ± 1°C during the day and night, respectively, under fluorescent lamps (TL5 14W/865; Philips, Seoul, Korea) with a PPFD of 180 ± 10 µmol·m-2·s-1 on the surface of the tray. The relative humidity of the room was maintained at 65 ± 10% and 75 ± 10% during the day and night, respectively, and the seedlings were soaked in water daily for 1 min. At one week after sowing, the seedlings were soaked daily in Hoagland nutrient solution (electrical conductivity (EC) 0.6 dS·m-1) for 1 min. Finally, uniform 14-day-old seedlings were selected and transplanted into a deep-flow technique (DFT) system [0.9 m (W) × 3.6 m (L) × 0.1 m (H)] that was installed in a greenhouse. Hoagland solution (EC 2.06 dS·m-1, pH 6.03) was supplied and replaced every 2 weeks. The average temperature and relative humidity in the greenhouse were maintained at 19.7°C and 63.5%, respectively, during the experimental period.
Treatments
Seedlings were transplanted into three DFT bed systems in a greenhouse with three plant spacing treatments: 31 cm (36 plants per bed), 20 cm (72 plants per bed), or 14 cm (144 plants per bed) (Trendmark, 2018). Each treatment was carried out on three beds and the size of each bed was 3.24 m2. The EC and pH values of the nutrient solutions were measured every 2 days using a portable conductivity and pH combo meter (HI98129; Hanna Instrument Co., Ltd., Woonsocket, USA).
Measurement of Plant Growth Parameters
The growth parameters of watercress plants were measured at 35 and 56 days after transplanting (DAT). Lateral branch length was manually measured using a measuring tape (STHT-36127; Stanley Electric Co., Ltd., Tianjin, China). Shoot fresh weight was measured by an electronic scale (ARG224; OHAUS Instruments Co., Ltd., Shanghai, China), while shoot dry weight was measured using the same scale after the samples had been dried in an oven (HB-502M; Hanback Sci, Suwon, Korea) at 79°C for 7 days. Yield was defined as the total shoot fresh weights of all plants in a given treatment group.
Determination of Individual Glucosinolate Concentrations in Leaves and Stems of Watercress
Samples from each treatment group were directly placed in liquid nitrogen after harvesting and stored at -70°C before being transferred to a dry freezer (TFD5503, ILShin biobase Co., Ltd., Korea), where they were stored at -50°C within 4 days. Next, each sample was ground into a fine powder using a porcelain mortar and pestle, and the powder was passed through mesh sieves. The watercress powder samples (0.1 g) were combined with 1.5 mL of boiling 70% (v/v) methanol (up to 70°C), mixed by vortexing, and centrifuged at 12,000 × g for 10 min at 4°C using a microcentrifuge (R17 Plus; Hanil Scientific Co., Ltd., Gimpo, Korea). The samples were then desulfurized by the DEAE Sephadex A-25 ion exchanger (Sigma-Aldrich Korea, Seoul, South Korea) to remove impurities. The supernatant of each sample was then refined using a 0.45 µm filter. Desulfo-glucosinolates were determined using a high-performance liquid chromatography (HPLC) system (1200 Infinity, Agilent Technologies, Santa Clara, CA, USA) using an Inertsil ODS-3 (C18) column 150 × 3.0 mm i.d., particle size 3 µm (GL Science, Tokyo, Japan) with a column temperature of 40°C, a flow rate of 0.4 mL·min-1, and a wavelength of 227 nm. Water (A) and 100% acetonitrile (B) were used as the solvent systems. The gradient program (total of 27 minutes) was used as follows: 0% solvent B (0 min); 0% solvent B (0 - 2 min); 10% solvent B (2 - 7 min); 31% solvent B (7 - 16 min); 31% solvent B (16 - 19 min); 0% solvent B (19 - 21 min); and 0% solvent B (21 - 27 min). Afterward, the HPLC peak area ratios and response factors (ISO 9167-1, 1992), with reference to a desulfo-sinigrin external standard, were used to determine the individual glucosinolates (glucohirsutin, gluconasturtiin, 4-methoxyglucobrassicin, glucosiberin, and glucobrassicin) in watercress (Table 1) (Jo et al., 2016; Jeon et al., 2017; Cuong et al., 2019). Glucosinolate content (µmol/shoot DW) refers to total glucosinolate concentration of a shoot (µmol·g-1 DW) multiplied by shoot dry weight (g). Glucosinolate content in a unit area (mmol/shoot DW/m2) refers to glucosinolate content in the shoot (µmol/shoot DW) multiplied by the number of plants in a square meter.
Table 1. Response factors of the desulfo-glucosinolates in watercress extracts and their retention times on C18 column
Statistical Analysis
The plant spacing experiment was performed by a completely randomized design. The experiment was repeated twice. Plant growth parameters were measured using seven plants (n = 7), whereas glucosinolate content was analyzed using three plants (n = 3) for each replication. One-way ANOVA was performed using SPSS 20.0 (SPSS, Inc., Chicago, IL, USA) as well as Tukey’s multiple range test, and graphs were created using SigmaPlot 10.0 (Systat Software, Inc., San Jose, CA, USA)
Results and Discussion
Plant Growth and Yield
At 35 DAT, lateral branch length increased significantly with increasing plant density, and the lowest lateral branch length was observed under 31-cm spacing (i.e., lowest plant density) (Fig. 1A). Likewise, the lateral branch length under 31-cm spacing showed a tendency to decrease compared with other treatments at 56 DAT (Fig. 1A), likely due to light intensity competition. Lateral branch length plays an important role in light interception. As such, in dense spacing, plants compete for light. The increasing trend of lateral branch length with increasing plant density demonstrates that lateral branch length can be enhanced by increasing light competition (Rajib et al., 2014). Similarly, plant height increased with increasing plant density, a phenomenon likely associated with light competition related to higher vegetative coverage in the higher plant population (Badi et al., 2004; Xiao et al., 2006). Indeed, greater plant height was also observed at the highest density of lettuce plants grown in a hydroponic culture system (Maboko, 2009).
\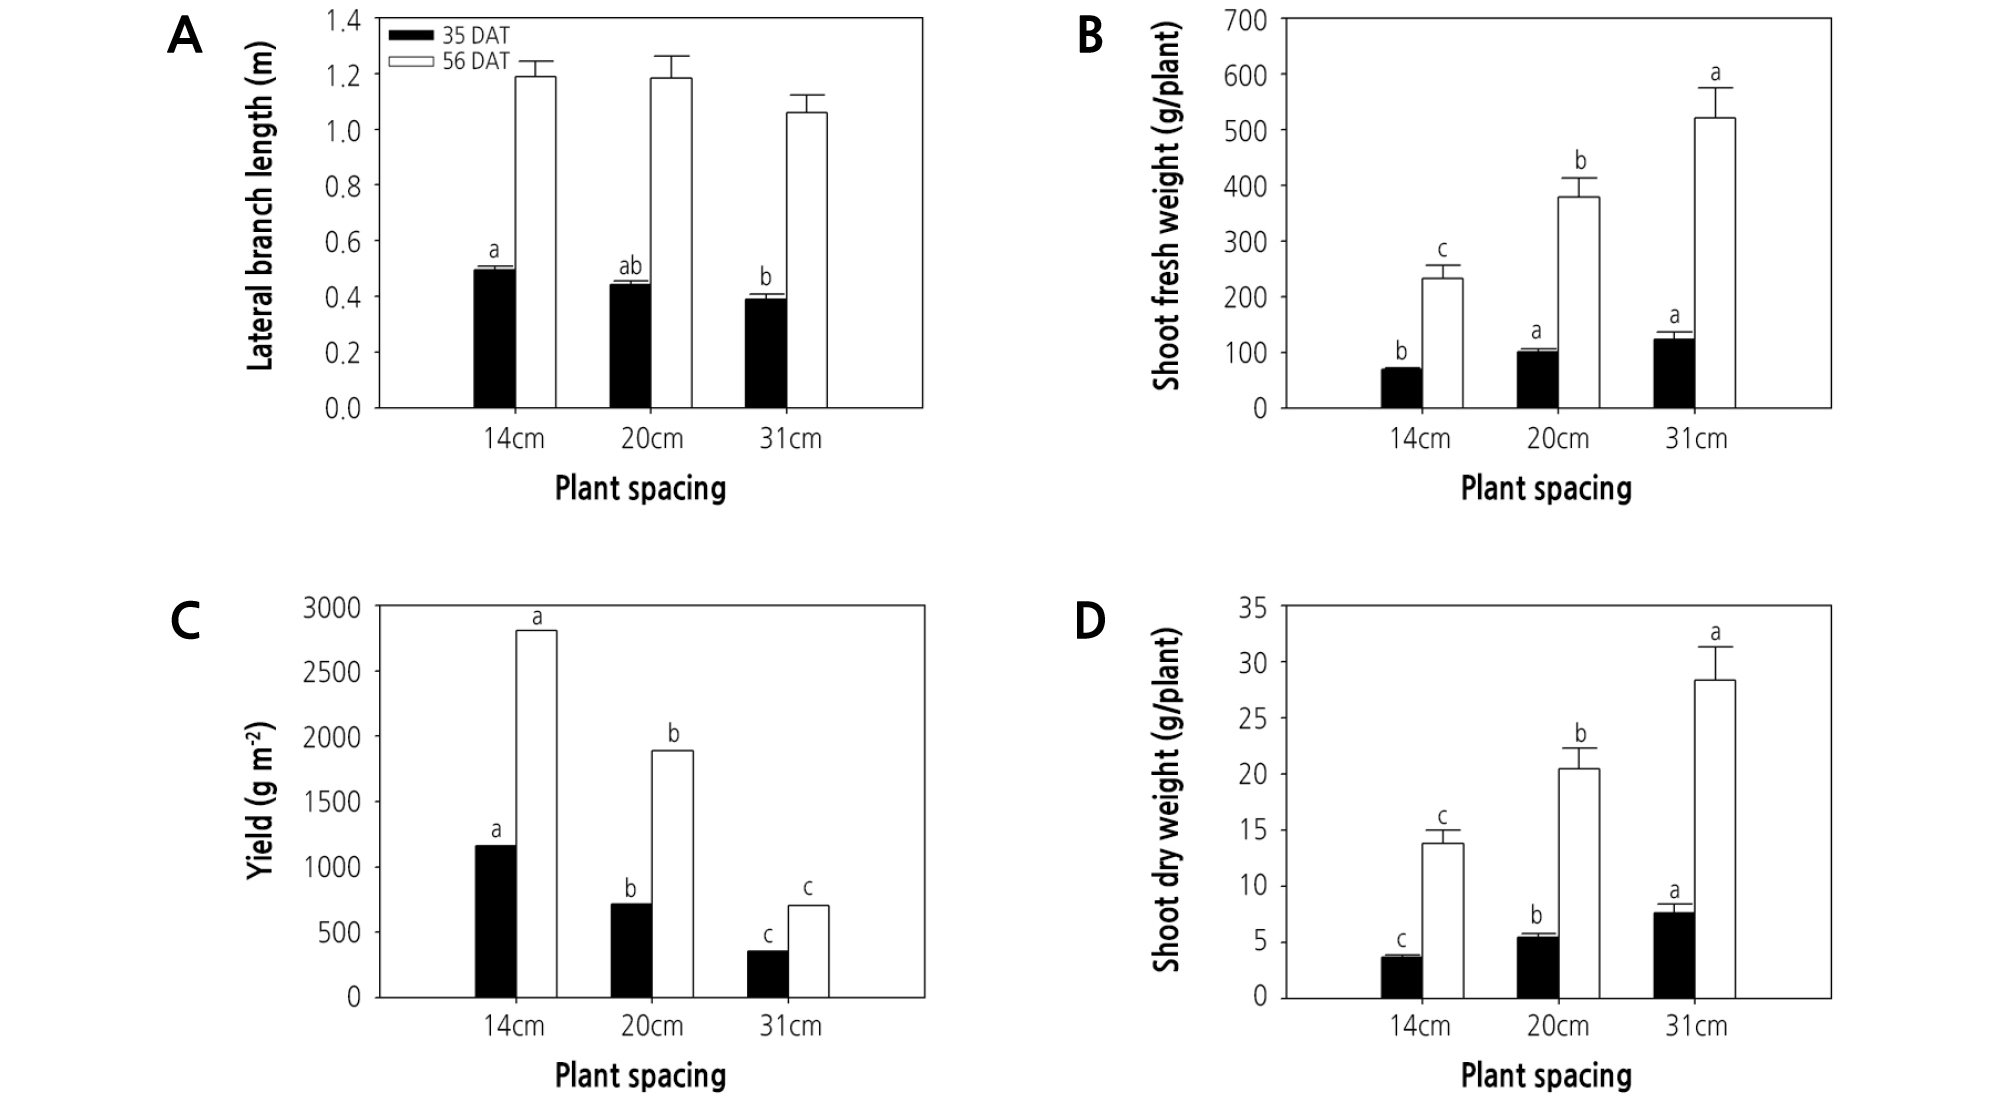
Fig. 1.
Effect of plant spacing on lateral branch length, shoot fresh and dry weight, and yield of hydroponic watercress at 35 and 56 days after transplanting (DAT). The data represent the means and the vertical bars indicate the standard error (n = 7). Different letters at the top of the bars indicate significant differences in plant spacing according to Tukey’s multiple range test (p ≤ 0.05).
Shoot fresh and dry weights increased significantly with increasing plant spacing (i.e., decreasing plant density), regardless of the harvest time (Fig. 1B and 1D), and were greatest under the 31-cm spacing treatment. The increased biomass observed under the greatest level of spacing could possibly be attributed to a greater availability of nutrients or light, and these results correspond to those of almost all previous studies that have examined the relationship between shoot fresh and dry weights and plant spacing, including in lettuce (Hasan et al., 2017), arrowroot (Qodliyati et al., 2018), carrot (Kabir et al., 2013), and sweet potato (Mortley et al., 1991). Nutrient uptake was previously shown to be enhanced under higher plant spacing, which is thought to be due to less competition for water, light, and nutrients (Mojiri and Arzani, 2003). Nitrogen, phosphorus, and potassium concentrations in plants were found to be higher under wider spacing compared with narrower spacing (Khalaj et al., 2012). Resource supply was limited by lower plant spacing because of competition between individual plants, which can lead to a reduction in plant biomass compared with higher plant spacing.
In contrast, the yield of watercress decreased significantly with increasing plant spacing, regardless of the harvest time (Fig. 1C), and the greatest plant density (i.e., 14-cm spacing) was associated with the greatest yield per unit area. More specifically, the yield (g·m-2) of watercress plants grown under 14-cm spacing was significantly greater (161 and 326%) than that of plants grown under 20- and 31-cm spacing at 35 DAT (Fig. 1C) and similarly greater (148 and 400%) at 56 DAT (Fig. 1C). Similarly, the total yield of potato decreased significantly with increasing plant spacing (Mangani et al., 2015), while onion yield decreased with increasing plant spacing (Khan et al., 2003; Caruso et al., 2014). The highest yield of Abelmoschus esculentus L. ‘moench’ was observed under the lowest level of plant spacing (Falodun and Ogedegbe, 2016), and the yield of leafy lettuce increased significantly with decreasing plant spacing in a hydroponic culture system (Maboko, 2009). These results demonstrate that, even though the greatest plant spacing treatment (31 cm) was advantageous for accumulating assimilations, the benefits were unable to compensate for the resulting low yield. Because yield per unit area is strongly associated with production profits, the plant spacing for watercress grown in hydroponic DFT systems should be minimized, to nearly 14 cm between plants, to obtain optimal yield.
Total Glucosinolate Concentration and Content
The present study detected five kinds of glucosinolates, namely glucohirsutin, gluconasturtiin, 4-methoxyglucobrassicin, glucosiberin, and glucobrassicin in watercress at different plant spacing treatments (Table 2). Gluconasturtiin was previously reported to be the most abundantly synthesized glucosinolate in watercress (Aires et al., 2013; Jeon et al., 2017). Furthermore, total glucosinolate concentrations were also shown to be greater in leaves than in stems (Fig. 2) (Jeon et al., 2017).
Table 2. Glucosinolate concentration of hydroponic watercress leaves and stems harvested at 35 and 56 days after transplanting (DAT) under different plant spacing regimes (14-, 20-, and 31 cm)
yMeans (n = 3) with different letters are significantly different (p < 0.05 by Tukey's multiple range test).
NS, *, **, ***Not significant or significance at p ≤ 0.05, 0.01, or 0.001.
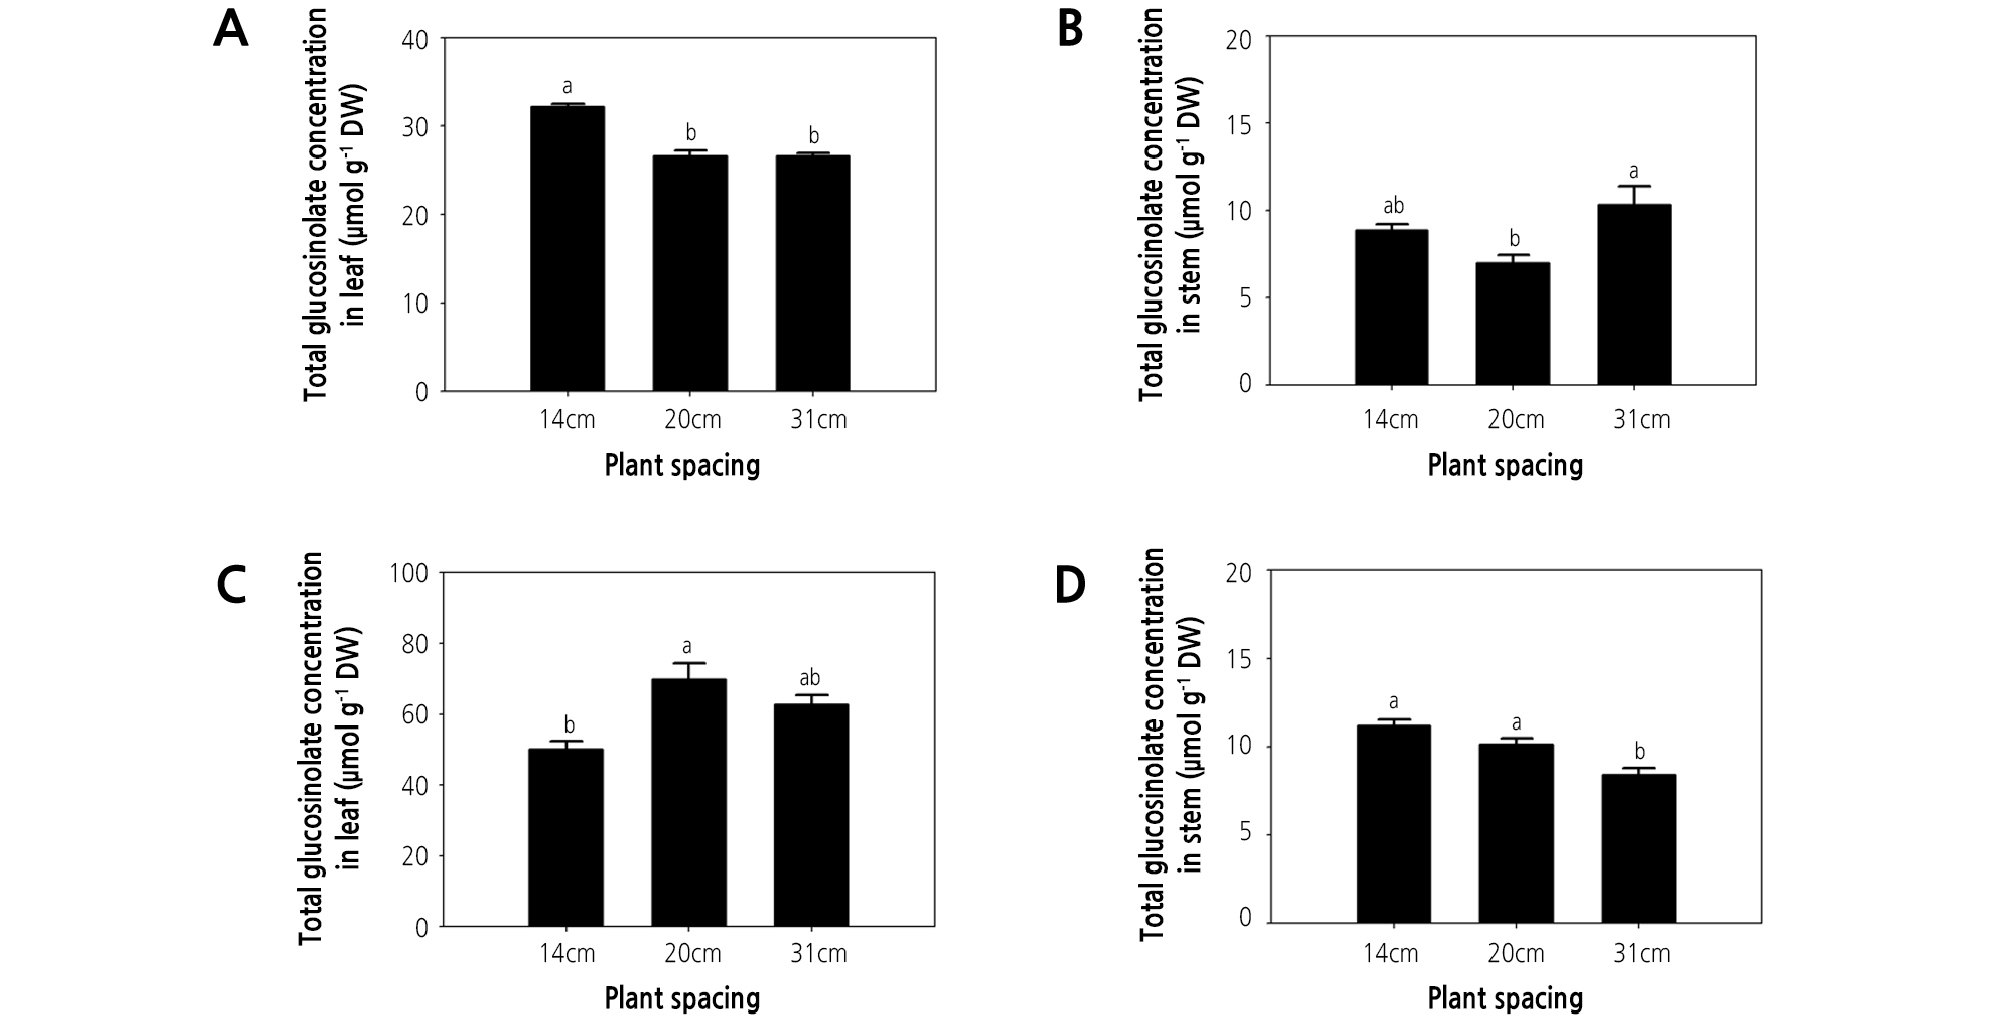
Fig. 2.
Effect of plant spacing on glucosinolate concentration of hydroponic watercress leaves and stems. (A, C) glucosinolate concentration of leaves at 35 and 56 days after transplanting (DAT). (B, D) glucosinolate concentration of stems at 35 and 56 DAT. The data represent the means and the vertical bars indicate the standard error (n = 3). Different letters at the top of the bars indicate significant differences in plant spacing according to Tukey’s multiple range test (p ≤ 0.05).
Glucosinolate concentration and content responded differently to the plant spacing treatments. At 35 DAT, the leaf concentration of glucohirsutin, gluconasturtiin, 4-methoxyglucobrassicin, glucosiberin, glucobrassicin, and total glucosinolate were greatest in plants grown under the highest plant density (i.e., 14-cm spacing; Table 2, Fig. 2A), and the same trend was observed for the total glucosinolate concentration in watercress shoots (Fig. 3A). These observations might indicate that nutrient availability is reduced as plant density increases. This may lead to nutrient deficiency because lower plant spacing causes greater competition for nutrients. Moreover, nutrient deficiency can lead to an increase in secondary metabolites in plants. Likewise, the content of rosmarinic acid in P. vulgaris was increased under low nutrient supply (Chen et al., 2011), the phenolic acid content of rice plants was increased under nutrient deficiency (Chishaki and Horiguchi, 1997), and the total polyphenol content of lettuce was maximized under nitrogen deficiency (Galieni et al., 2015). Secondary metabolites in plants are affected by nutrient availability. Nitrogen and phosphorus deficiency in a hydroponic system induced the accumulation of flavonol content in tomato and antioxidant activity in Arabidopsis thaliana (Stewart et al., 2001; Kandlbinder et al., 2004). Phytochemicals in lettuce were increased under nitrogen stress conditions (Galieni et al., 2015). In contrast, the greatest total glucosinolate content in watercress shoots was obtained under the 31-cm spacing treatment at 35 DAT. However, this may be due to total glucosinolate content being dependent on shoot dry weight (Fig. 3C). It is likely that greater plant density increases plant shading. Indeed, in agreement with the present study, the steviol glycoside content of stevia was greatest under the densest planting, due to competition for water, light, and nutrients (Benhmimou et al., 2017). Meanwhile, the total glucosinolate concentration in watercress stems at 35 DAT was greater under 31- and 14-cm spacing treatments than under 20-cm spacing (Fig. 2B). Similarly, proline and phenol content and antioxidant activity (FRAP and DPPH) of spinach were greatest under low plant density treatment, possibly due to the effects of plant density on light availability (Machado et al., 2018). Therefore, greater plant spacing is likely to enhance the glucosinolate concentration of watercress by providing abundant nutrients and light, among other factors.
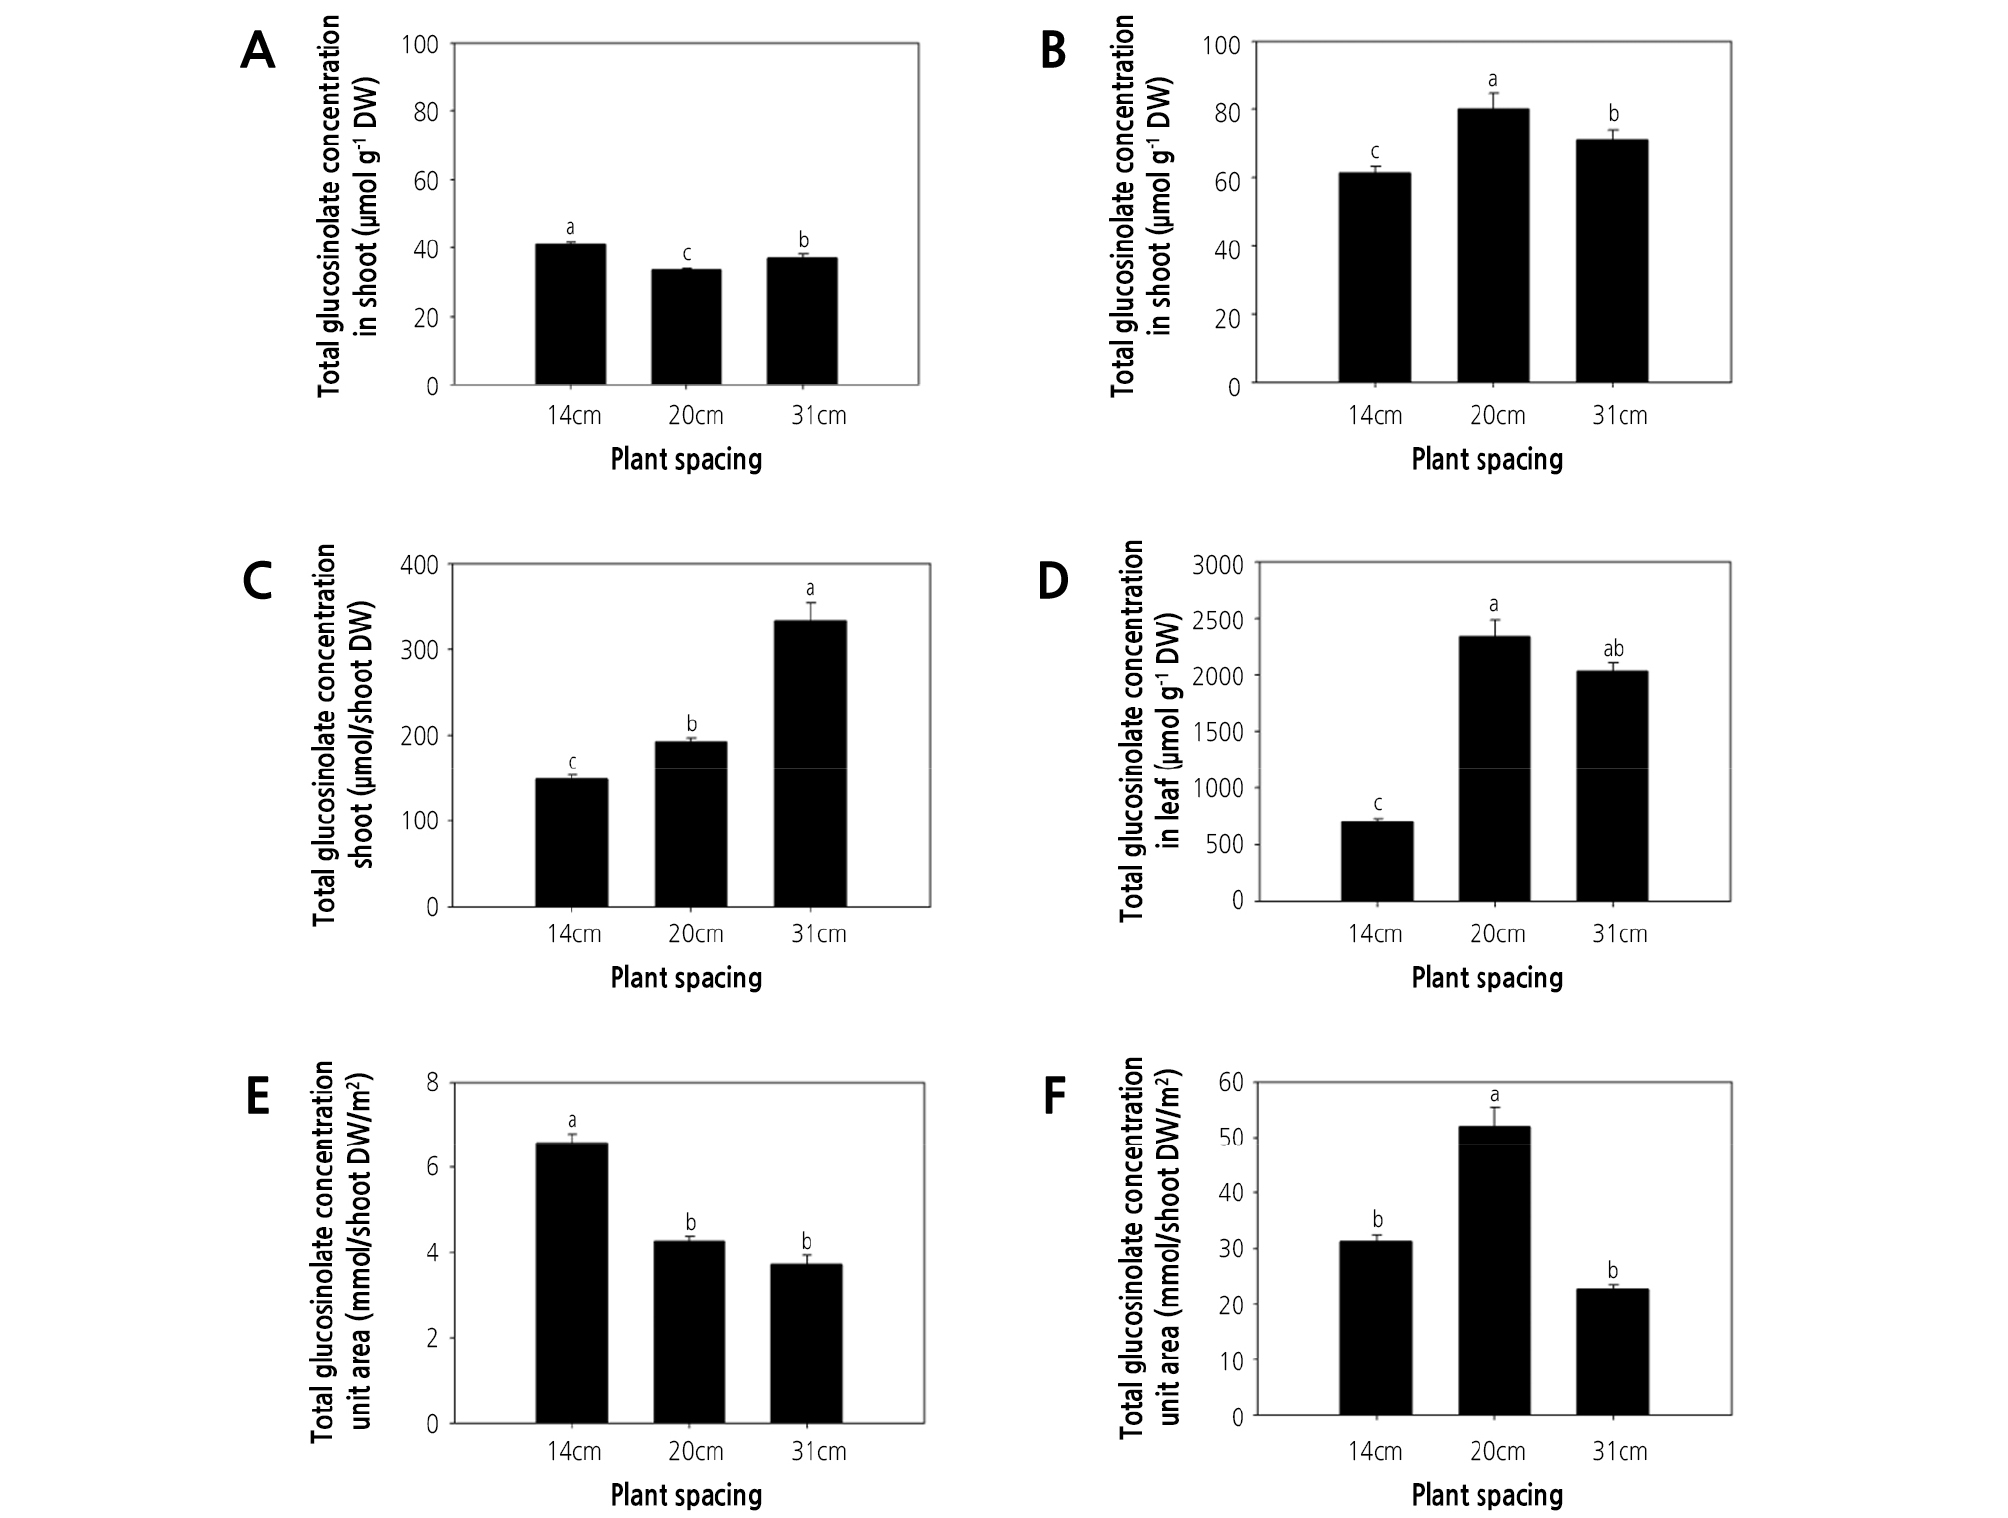
Fig. 3.
Effect of plant spacing on glucosinolate concentration and content in watercress. (A, B) total glucosinolate concentration in shoots at 35 and 56 days after transplanting (DAT). (C, D) total glucosinolate content in shoots at 35 and 56 DAT. (E, F) total glucosinolate content in the unit area of shoots at 35 and 56 DAT. The data represent the means and the vertical bars indicate the standard error (n = 3). Different letters at the top of the bars indicate significant differences in plant spacing according to Tukey’s multiple range test (p ≤ 0.05).
At 56 DAT, the leaf concentration of glucosiberin, glucohirsutin, glucobrassicin, and total glucosinolate were greatest under the 20-cm spacing treatment (Table 2). Therefore, the total glucosinolate concentration of watercress shoots at 56 DAT was highest under the 20-cm spacing treatment (Fig. 3B). This could be related to competition for light. Similarly, the normal light intensity (natural daylight) increased gluconapin (122%), glucobrassicanapin (497%), glucobrassicin (352%), 4-methoxyglucobrassicin and gluconasturtiin (225%), and neoglucobrassicin concentration (115%) in pakchoi, compared with other treatments (shading of 60% natural daylight and the highest light intensity (PPFD: 640 µmol·m-2·s-1)) (Yang et al., 2009). At 56 DAT, the total glucosinolate concentration of watercress shoots was approximately 2-fold greater than that observed at 35 DAT (Fig. 3A and 3B). Meanwhile, at 56 DAT, the stem content of glucosiberin, glucohirsutin, glucobrassicin, and gluconasturtiin was greater under 14- and 20-cm spacing than under the 31-cm spacing treatment (Table 2), with a similar trend observed for total glucosinolate concentration in stems (Fig. 2D).
At 56 DAT, the total glucosinolate concentration in shoots was significantly greater (130.46 and 112.53%) under the 20-cm spacing treatment than under either 14- or 31-cm spacing (Fig. 3B), and the total glucosinolate content per total shoot weight was significantly greater (332 and 289%) under the 20- and 31-cm spacing treatments than under 14-cm spacing (Fig. 3D) because the shoot dry weight continually increased with increasing plant spacing. Meanwhile, at 35 DAT, the total glucosinolate concentration was greatest under 14-cm spacing, possibly due to light and nutrient competition. However, the total glucosinolate concentration at 56 DAT was greatest under the 20-cm spacing treatment, which may be related to the gradual limitation of nutrient and light availability during the 2 weeks after the first harvest (35 DAT). The maximum total glucosinolate content per unit area was observed under the 14-cm spacing treatment at 35 DAT (6.58 mmol/shoot DW/m2) and under the 20-cm spacing treatment at 56 DAT (51.99 mmol/shoot DW/m2; Fig. 3E and 3F), since total glucosinolate content is highly dependent on the number of plants per unit area. These results indicate that the yield of watercress can be optimized under 14-cm plant spacing and harvesting at 35-DAT, whereas the production of glucosinolate can be optimized under 20-cm plant spacing and harvesting at 56-DAT.
Conclusions
The results of the present study indicate that the spacing of watercress plants should be optimized for the purpose of cultivation. More specifically, the yield of watercress can be optimized under 14-cm plant spacing and a 35-DAT harvest time, whereas the production of glucosinolate can be optimized under 20-cm plant spacing and a 56-DAT harvest time, without negatively affecting plant growth or yield in a hydroponic DFT culture system. Among five individual glucosinolates, gluconasturtiin is the major glucosinolate in leaves and stems of watercress. In addition, these results also provide quality information on each part of the watercress plant (leaves and stems) according to the user's demands for the individual glucosinolates. This study represents the first recommendation for standard plant spacing for watercress grown using a hydroponic culture system, at the same time providing an important reference for producers attempting to optimize plant spacing in greenhouse-based hydroponic culture systems or plant factories.
