

Introduction
Materials and Methods
Plant Materials and Growth Conditions
Light Treatments
Growth Characteristics
Photosynthetic Rate
Total Phenolic Content
Antioxidant Capacity
Statistical Analysis
Results
Growth Characteristics and Photosynthetic Rate
Total Phenolic Content and Antioxidant Capacity
Discussion
Growth Characteristics
Photosynthetic Rate
Total Phenolic Content and Antioxidant Capacity
Introduction
The ice plant (Mesembryanthemum crystallinum) is a succulent plant native to the Namibian desert in southern Africa and has been utilized as a vegetable in Europe and Asia, including Japan and Taiwan. The plant is covered with large, glistening bladder cells, which look like ice. Thus, the plant’s common name is ice plant, or crystalline ice plant. The ice plant is known to be rich in minerals, such as potassium and sodium (Kang et al., 2016), antioxidants (Lee et al., 2015), and polyols, such as myo-inositol and pinitol, which are effective in the prevention of cardiovascular diseases, liver damage, and cancer (Do and Koo, 2007). In particular, pinitol is used as a natural blood glucose regulator for type 2 diabetes patients around the world because of its excellent blood glucose control effects (Son et al., 2009). Unlike other plants that contain polyols, such as soybeans (Glycine max) and pine (Pinus sp.) needles, polyols contained in the ice plant are easy to uptake because the plant is consumed as a fresh material without cooking (Agarie et al., 2009).
Ice plant has a high nutrient absorption ability when compared with other vegetables such as carrots (Daucus carota subsp. sativus), radishes (Raphanus raphanistrum subsp. sativus), and tomatoes (Solanum lycopersicum) (Shevyakova et al., 2003; Yang et al., 2009). It is safer to cultivate ice plant in hydroponic systems rather than in the field because there is concern regarding the absorption of heavy metals contained in the soil during commercial field cultivation for mass production. In addition, ice plant is sensitive to environmental stresses, such as drought, low temperature, and high light intensity; consequently, lateral shoots occur, and leaves become smaller and thicker, depreciating the commercial value of the plant.
Aerial environmental factors, such as light, temperature, CO2, and humidity, as well as underground factors, such as chemical conditions [pH and electrical conductivity (EC)], temperature, and dissolved oxygen nutrient solution, can be artificially controlled in plant factories to promote growth and development. As a result, it is possible to produce high-quality, uniform crops throughout the year by creating a suitable environment (Kozai, 2013). However, mass production of a high-value crop is necessary to make plant factories economically viable because of the considerable expense involved in installation and operation. In this respect, cultivation methods for producing high-quality ice plants should be established for making plant factories commercially viable. Aspects of the optimal cultivation environment of ice plants in plant factories have been studied, including photoperiod (Jo et al., 2016), temperature (Cha et al., 2016a), nutrient solution, light intensity, planting density (Cha et al., 2016b), and a photosynthetic (photosynthesis and stomatal conductance) model (Park et al., 2016). However, there is a lack of research on the effect of light quality on the growth of ice plant and the production of bioactive compounds.
Therefore, the goals of this study were to determine the growth and content of bioactive compounds of ice plant grown under monochromatic light-emitting diodes (LEDs) and different combinations of red (R) and blue (B) LEDs or red + blue (RB) with green (G) LEDs, and to provide basic information on optimal light conditions for the mass production of ice plant in plant factories under artificial light.
Materials and Methods
Plant Materials and Growth Conditions
Seeds of the common ice plant provided by Jeju National University were sown and germinated in 105-cell plug trays with horticultural growing medium (Myung-Moon; Dongbu Hannong, Seoul, Korea). Three-week-old seedlings were transplanted into plastic pots [6.5 × 6.5 × 8 cm (L × W × H)] that were placed on a sub-irrigation tray [32 × 22 × 6.5 cm (L × W × H)]. Twenty-five pots per LED treatment were cultivated in a plant factory with artificial light under the following conditions: air temperature of 23°C, relative humidity of 60%, 1,000 µmol·mol-1 CO2, a 12 h photoperiod, and a photosynthetic photon flux density (PPFD) of 170 µmol·m-2·s-1. The nutrient solution (Cha et al., 2016b; EC 1.5 dS·m-1, pH 6.0) was subirrigated to the plants, and the solution was maintained at a 1-cm depth in the sub-irrigation tray and changed once every two weeks.
Light Treatments
Monochromatic R (654 nm), G (518 nm), and B (456 nm) LEDs (Itswell, Incheon, Korea) were used alone and in four combinations of RB LEDs (R:B = 9:1, 8:2, 7:3, and 6:4, based on chip number) and five combinations of RGB LEDs (R:G:B = 9:1:0, 8:1:1, 7:1:2, 6:1:3, and 5:1:4). Fluorescent lamps (FL; HYG-FPL 36 W-R; Nam Yung, Seoul, Korea) were used as the control. The PPFD was measured at 12 points in the cultivation position for each light treatment using a quantum sensor (LI-1400; Li-Cor, Lincoln, NE, USA), and the average was set to 170 µmol·m-2·s-1. The light spectrum was analyzed at 0.4 nm intervals using a spectroradiometer (Jaz-EL 200; Ocean Optics, Dunedin, FL, USA) for each light treatment (Fig. 1), and the results were expressed as a PPFD of 400 nm to 700 nm (Table 1). During the cultivation period, the subirrigation trays were rotated clockwise once a day for uniformity of light distribution.
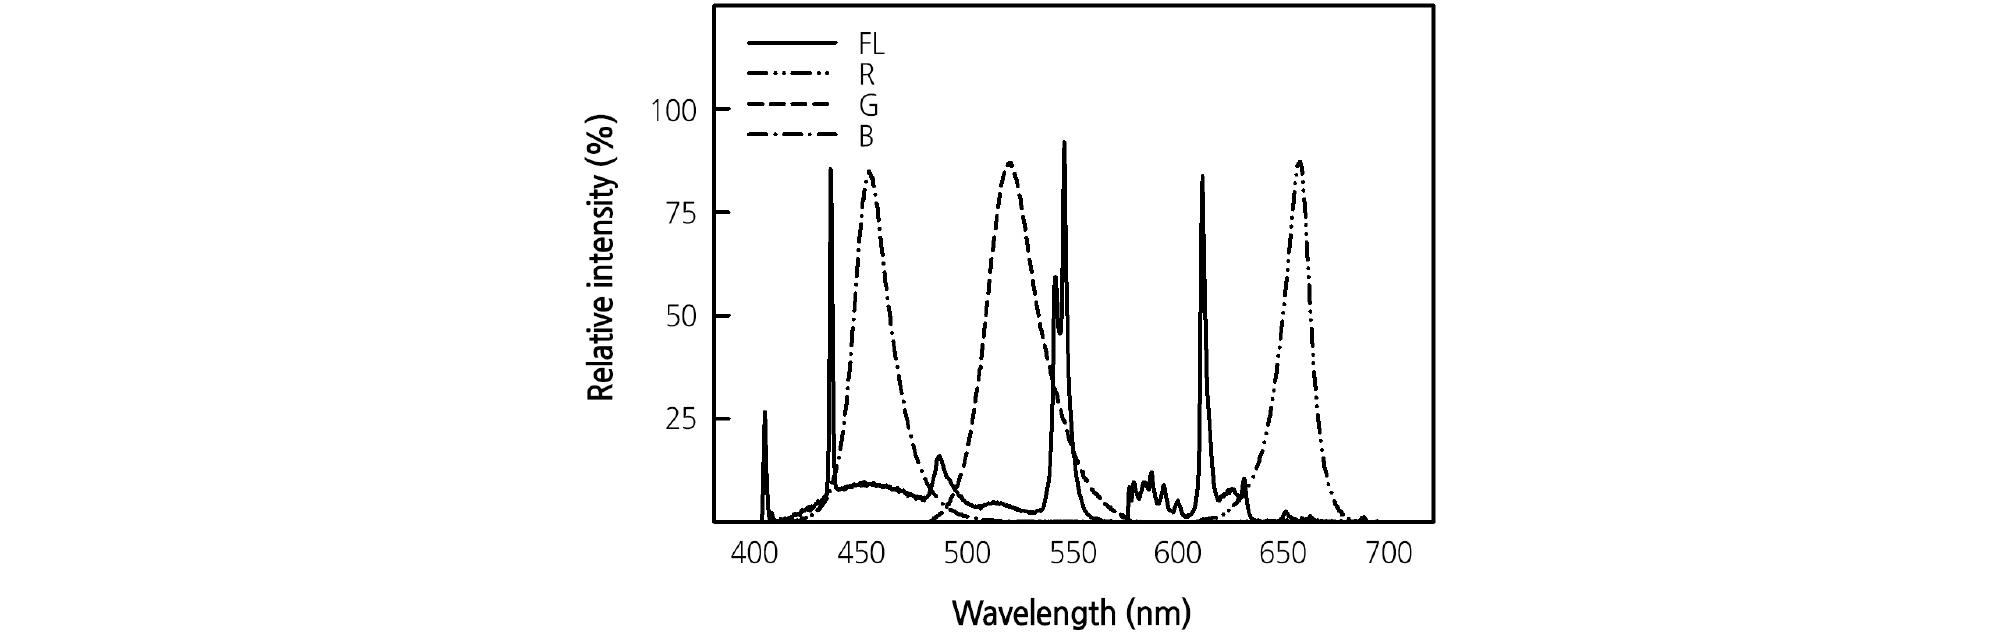
Table 1. Spectral data for monochromatic and various combined ratios of red (R) to blue (B), and RB with green (G) light-emitting diodes (LEDs). Data were recorded at the location of 170 𝜇mol·m-2·s-1 with a spectrophotometer
yFluorescent lamp.
xRatios of red, green, and blue LEDs based on the number of LED chips.
Growth Characteristics
To compare the growth characteristics of the plants in the different light treatments, fresh weights of shoots and roots, number of leaves, leaf area, specific leaf weight, and SPAD value were measured at 4 weeks of treatment. Fresh weights of shoots and roots were measured using a digital scale (Si-234; Denver Instrument, Denver, CO, USA). The number of leaves was counted, with the exception of leaves in lateral shoots, and leaf area was measured using a leaf area meter (LI-3100C; Li-Cor, Lincoln, NE, USA). Specific leaf weight, representing leaf thickness, was expressed as shoot dry weight per leaf area. The SPAD value, representing the chlorophyll content of the third pair of leaves from the bottom leaf pair, was measured using a portable chlorophyll meter (SPAD-502; Konica Minolta, Tokyo, Japan).
Photosynthetic Rate
The photosynthetic rate of the plants was measured after 4 weeks of treatment. A portable photosynthesis system (LI-6400; Li-Cor, Lincoln, NE, USA) equipped with a transparent open-type leaf chamber (LI-6400-08, 2 × 3 cm; Li-Cor, Lincoln, NE, USA) was adopted to measure the photosynthetic rate under each light treatment (average PPFD of 170 µmol·m-2·s-1). The photosynthetic rate was measured from 10:00, one hour after the lights were turned on, until 14:00. The measurement conditions were similar to the growing conditions: air flow rate, CO2 concentration, and block temperature of the photosynthesis system were set at 400 µmol·s-1, 1,000 µmol·mol-1, and 23°C, respectively.
Total Phenolic Content
Shoot samples of ice plant were freeze-dried for 72 h in a freeze dryer (FD8512; Ilshin Lab. Co. Ltd., Dongducheon, Korea) and then finely ground into powder with a mill (Tube Mill control, IKA, Wilmington, NC, USA) for 2 min at 25,000 rpm. All the powdered samples were stored at 4°C until use.
Total phenolic content was analyzed using a slightly modified Folin-Ciocalteu method (Ainsworth and Gillespie, 2007). The powder samples (approximately 40 mg) were mixed with 4 mL of 80% (v/v) acetone and extracted for 15 min using an ultrasonic sonicator (SK5210HP; Hangzhou Nade Scientific Instrument, Zhejiang, China). After incubation in the dark at 4°C for 12 h, the samples were centrifuged at 3,000 × g for 2 min at 4°C, and the supernatants were used for analysis. The remainder of the procedure was then performed as described by Son and Oh (2013). Results were expressed as milligrams of gallic acid equivalents (Acros Organics, Geel, Belgium) (GAE) per unit dry weight (GAE mg·g-1 DW) or gallic acid equivalents per plant (GAE mg/plant).
Antioxidant Capacity
Sample preparation was the same as that for total phenolic content. Antioxidant capacity was measured using 2,2-Azino-bis (3-ethylbenzothiazoline-6-sulfonic acid) (ABTS; Sigma-Aldrich, St. Louis, MO, USA) as described in Son and Oh (2013). The extracts were stored for 12 h in the dark at -20°C and then centrifuged at 3,000 × g for 2 min at -20°C. The extracted supernatant was diluted 10-fold with 80% acetone for analysis. ABTS was diluted with 5 mM PBS (phosphate buffer saline, pH 7.4, ionic strength [150 mM] NaCl), and the absorbance was adjusted to 0.7 ± 0.5 at 730 nm. Results were expressed as trolox (6-Hydroxy-2, 5, 7, 8-tetramethylchromane-2-carboxyl acid) (Sigma-Aldrich, St. Louis, MO, USA) equivalent antioxidant capacity (mM) per unit dry weight (mM TEAC·g-1 DW) or per plant (mM TEAC/ plant).
Statistical Analysis
For all measurement parameters, five individual plants were considered as five biological replicates, except for photosynthesis rate, which had four replicates. The SAS program (SAS 9.4, SAS Institute, Cary, NC, USA) was used for statistical analysis. A one-way analysis of variance (ANOVA) was conducted to test for significant differences among treatments, and the means were compared using Duncan’s multiple range test at p < 0.05.
Results
Growth Characteristics and Photosynthetic Rate
Among the monochromatic LED treatments, R LEDs showed a positive effect on shoot fresh weight (Fig. 2A). The R8B2 and R7B3 treatments resulted in higher fresh weights when compared with the other RB treatments, despite the lack of statistical significance. Among the RGB treatments, R8G1B1 resulted in the highest shoot weight, which was significantly higher when compared with that of the R9G1B0 and R6G1B3 treatments. The shoot weight in the control (FL) was 12 g/plant, which was not significantly different from that of the treatments except for the monochromatic B LED treatment. The root fresh weight did not significantly differ among the monochromatic LED treatments (Fig. 2B). In the RB treatments, the root fresh weight tended to increase as the ratio of B LEDs increased, but there was no significant difference. The R8G1B1 treatment showed the significantly highest root fresh weight among all treatments and the control. When compared to the control (FL), the LED lights used in this study were suitable for the growth of ice plants.
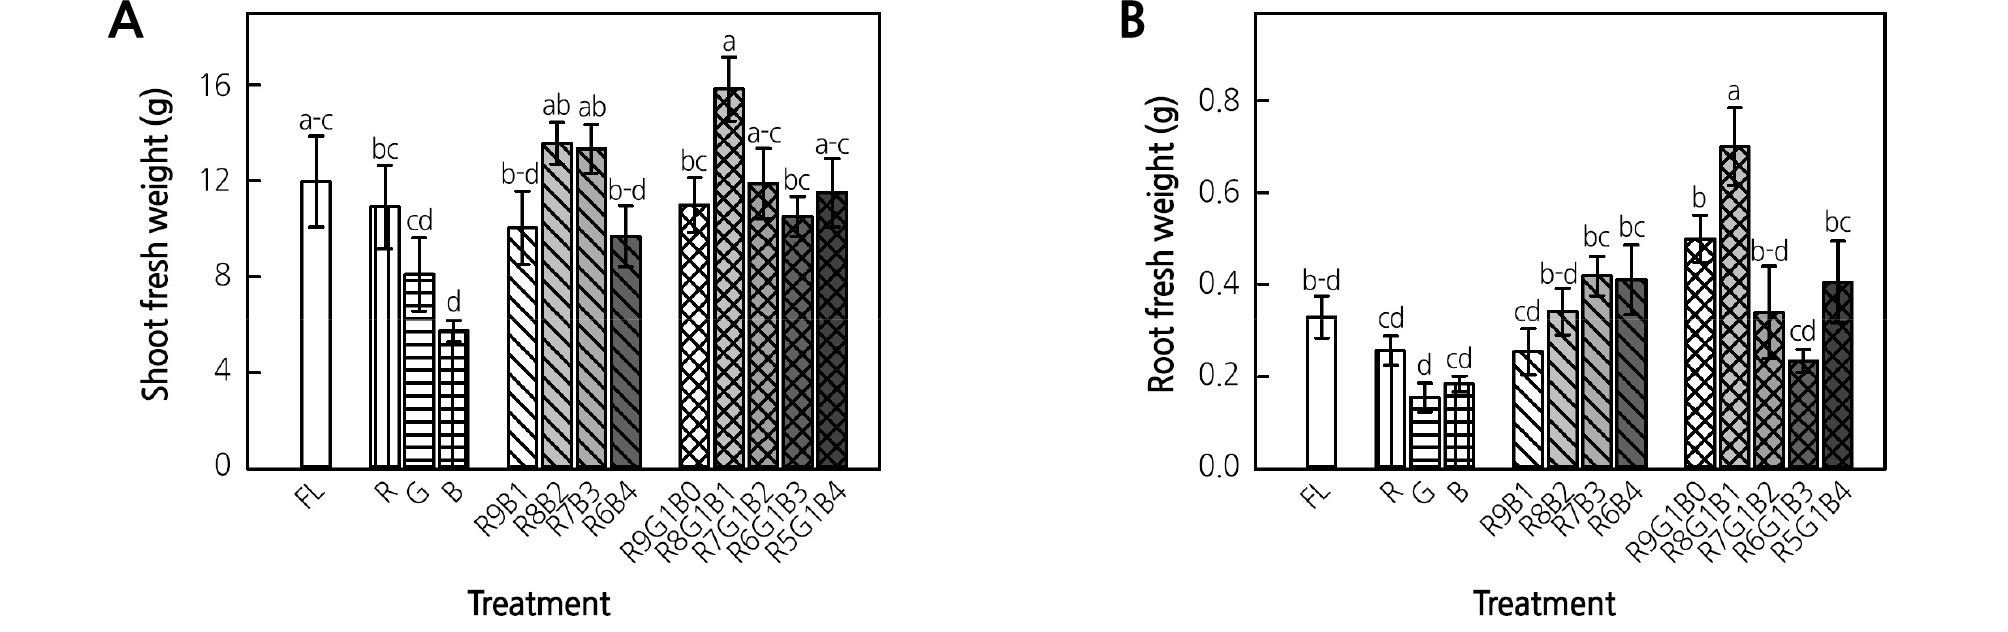
Fig. 2.
Shoot (A) and root (B) fresh weight of ice plant grown under monochromatic and various combined ratios of red (R) to blue (B) and RB with green (G) light-emitting diodes (LEDs) at 4 weeks of treatment. Data indicate the means ± SE (n = 5). Different letters above bars indicate significant differences at p < 0.05.
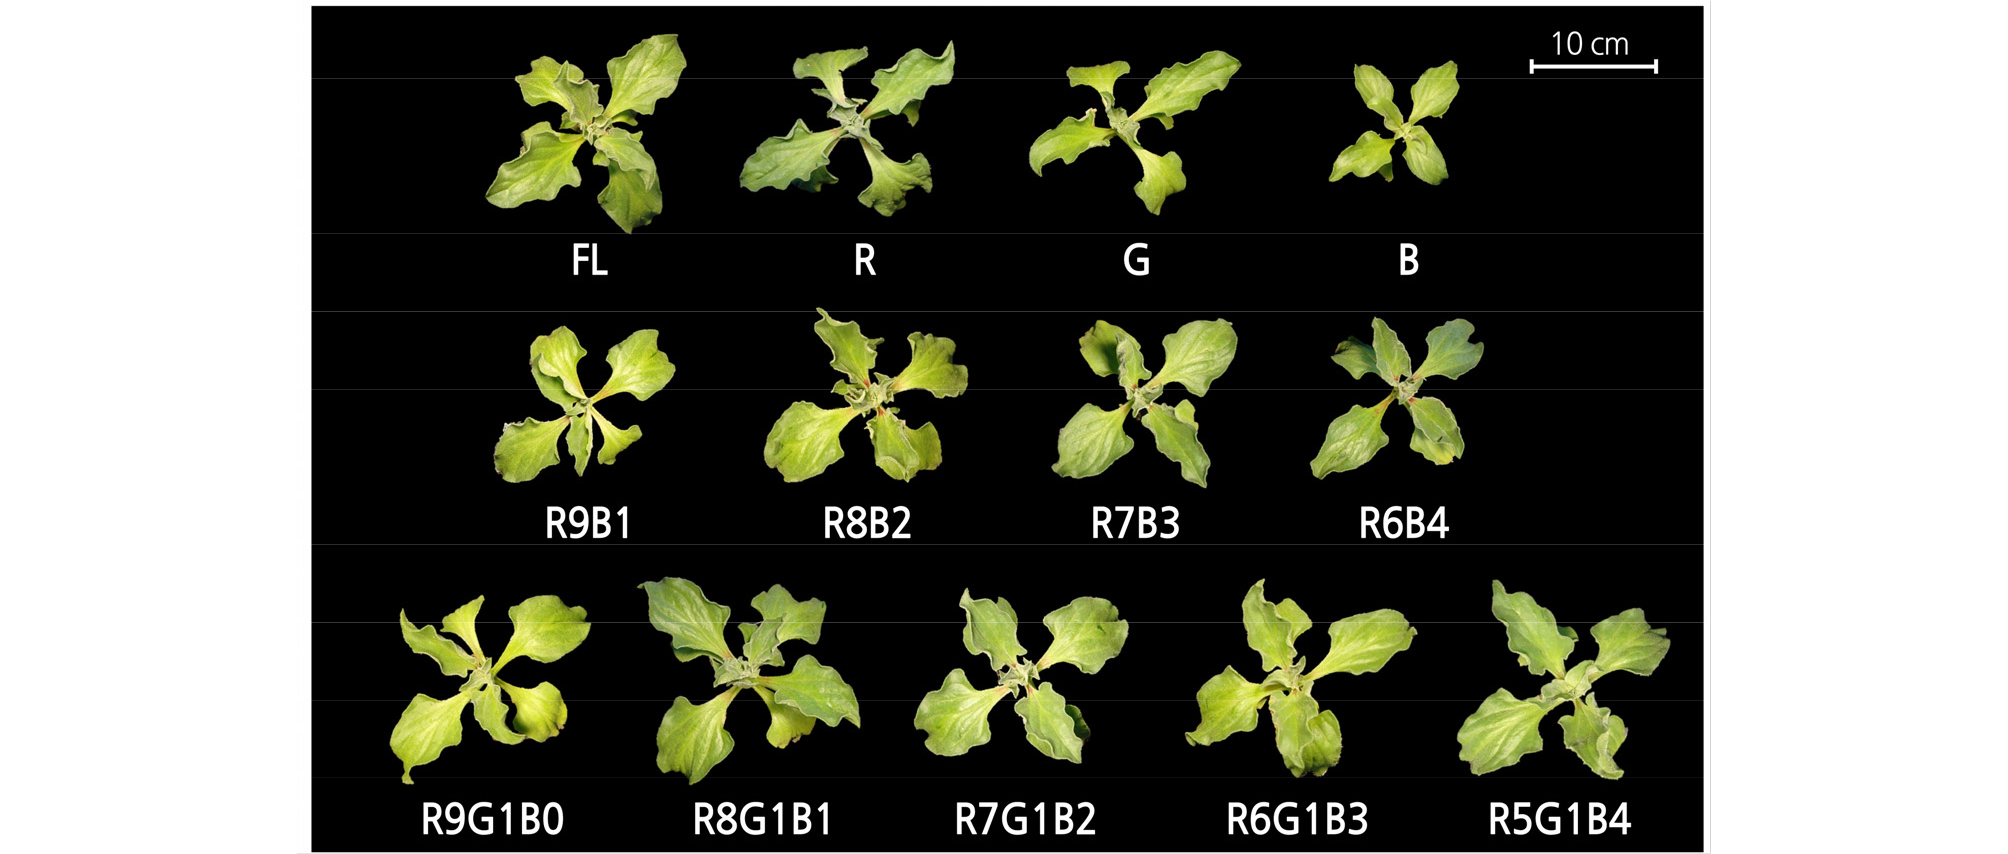
Light quality affected both the leaf development and chlorophyll content of the plants in this study (Table 2 and Fig. 3). The number of leaves per plant grown under B LEDs was higher than that under R LEDs. In the case of the RB treatments, R8B2 and R7B3 resulted in eight leaves, which was significantly higher than the number of leaves in the R6B4 treatment. Furthermore, the RGB treatments did not result in any significant differences. The control had a value similar to the highest value from each treatment group. Leaf area showed a trend similar to that of shoot fresh weight. Leaf area was the highest under treatments R, R8B2, R7B3, and R8G1B1. The specific leaf weight, a relative indicator of leaf thickness, increased as the ratio of B LEDs increased in the RB treatments. The RGB treatments showed a trend similar to that of the RB treatments, with the exception of the R8G1B1 treatment. No significant difference was observed among the SPAD values of plants in the monochromatic LED treatments, and these were significantly lower than the values of the control and the other treatments, except in the case of R9B1, R9G1B0, and R6G1B3.
Table 2. Number of leaves, leaf area, specific leaf weight, and SPAD values of ice plant subjected to monochromatic and various combined ratios of red (R) to blue (B), and RB with green (G) light-emitting diodes (LEDs) at 4 weeks of treatment (n = 5)
yMean separation within a row by Duncan's multiple range test at p < 0.05.
R LEDs resulted in the highest photosynthetic rate among the monochromatic LED treatments followed by B and G LEDs (Fig. 4). The photosynthetic rate under both the RB and RGB treatments decreased as the ratio of R LEDs decreased. Overall, the RGB treatments with 5 - 6% G light resulted in a higher photosynthetic rate than did the RB treatments. The control showed a significantly lower photosynthetic rate when compared with the R treatment, and all RB and RGB treatments, and had a value similar to that in the B LED treatment. The G LED treatment resulted in the lowest photosynthetic rate among all treatments.
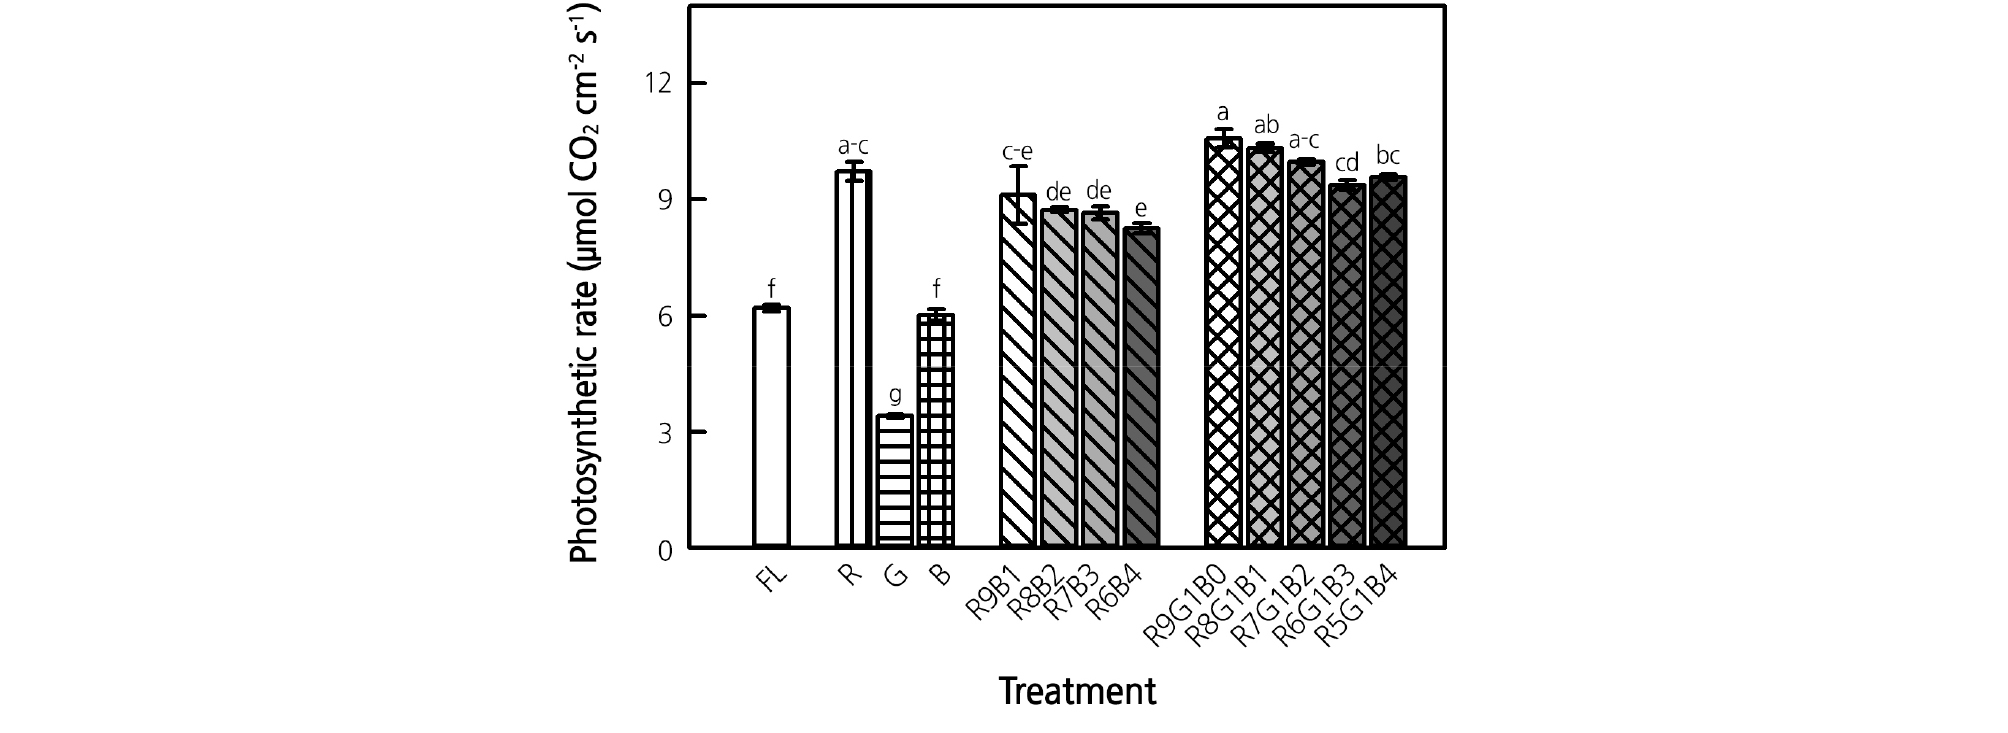
Fig. 4.
Photosynthetic rate of ice plant grown under monochromatic and various combined ratios of red (R) to blue (B) and RB with green (G) light-emitting diodes (LEDs) at 4 weeks of treatment. Data indicate the means ± SE (n = 4). Different letters above bars indicate significant differences at p < 0.05.
Total Phenolic Content and Antioxidant Capacity
Among the monochromatic LED treatments, the B LED treatment resulted in the highest value for total phenolic content per unit dry weight, which was significantly higher than that of the G LED treatment (Fig. 5A). There were no significant differences among the control, RB, and RGB treatments, except for R9G1B0, which did not contain blue light. Regarding the antioxidant capacity per unit dry weight, the B LED treatment resulted in a significant difference and had the highest value among the monochromatic LED treatments (Fig. 5B). Antioxidant capacity per unit dry weight tended to increase as the ratio of B LEDs increased in the RB treatments. For the RGB treatments, the antioxidant capacity per unit dry weight in R7G1B2 and R6G1B3 was significantly higher than those in R9G1B0 and R8G1B1. The control had 9.5 mM TEAC·g-1 DW, which was higher than the highest values from each treatment group. Regarding the total phenolic content per plant, the high value ranged around 1.2 GAE mg/plant and occurred in the control, R8B2, R7B3, and R8G1B1 treatments, which was similar to the shoot growth results (Fig. 5C). Antioxidant capacity per plant showed a trend similar to that of the total phenolic content per plant (Fig. 5D).
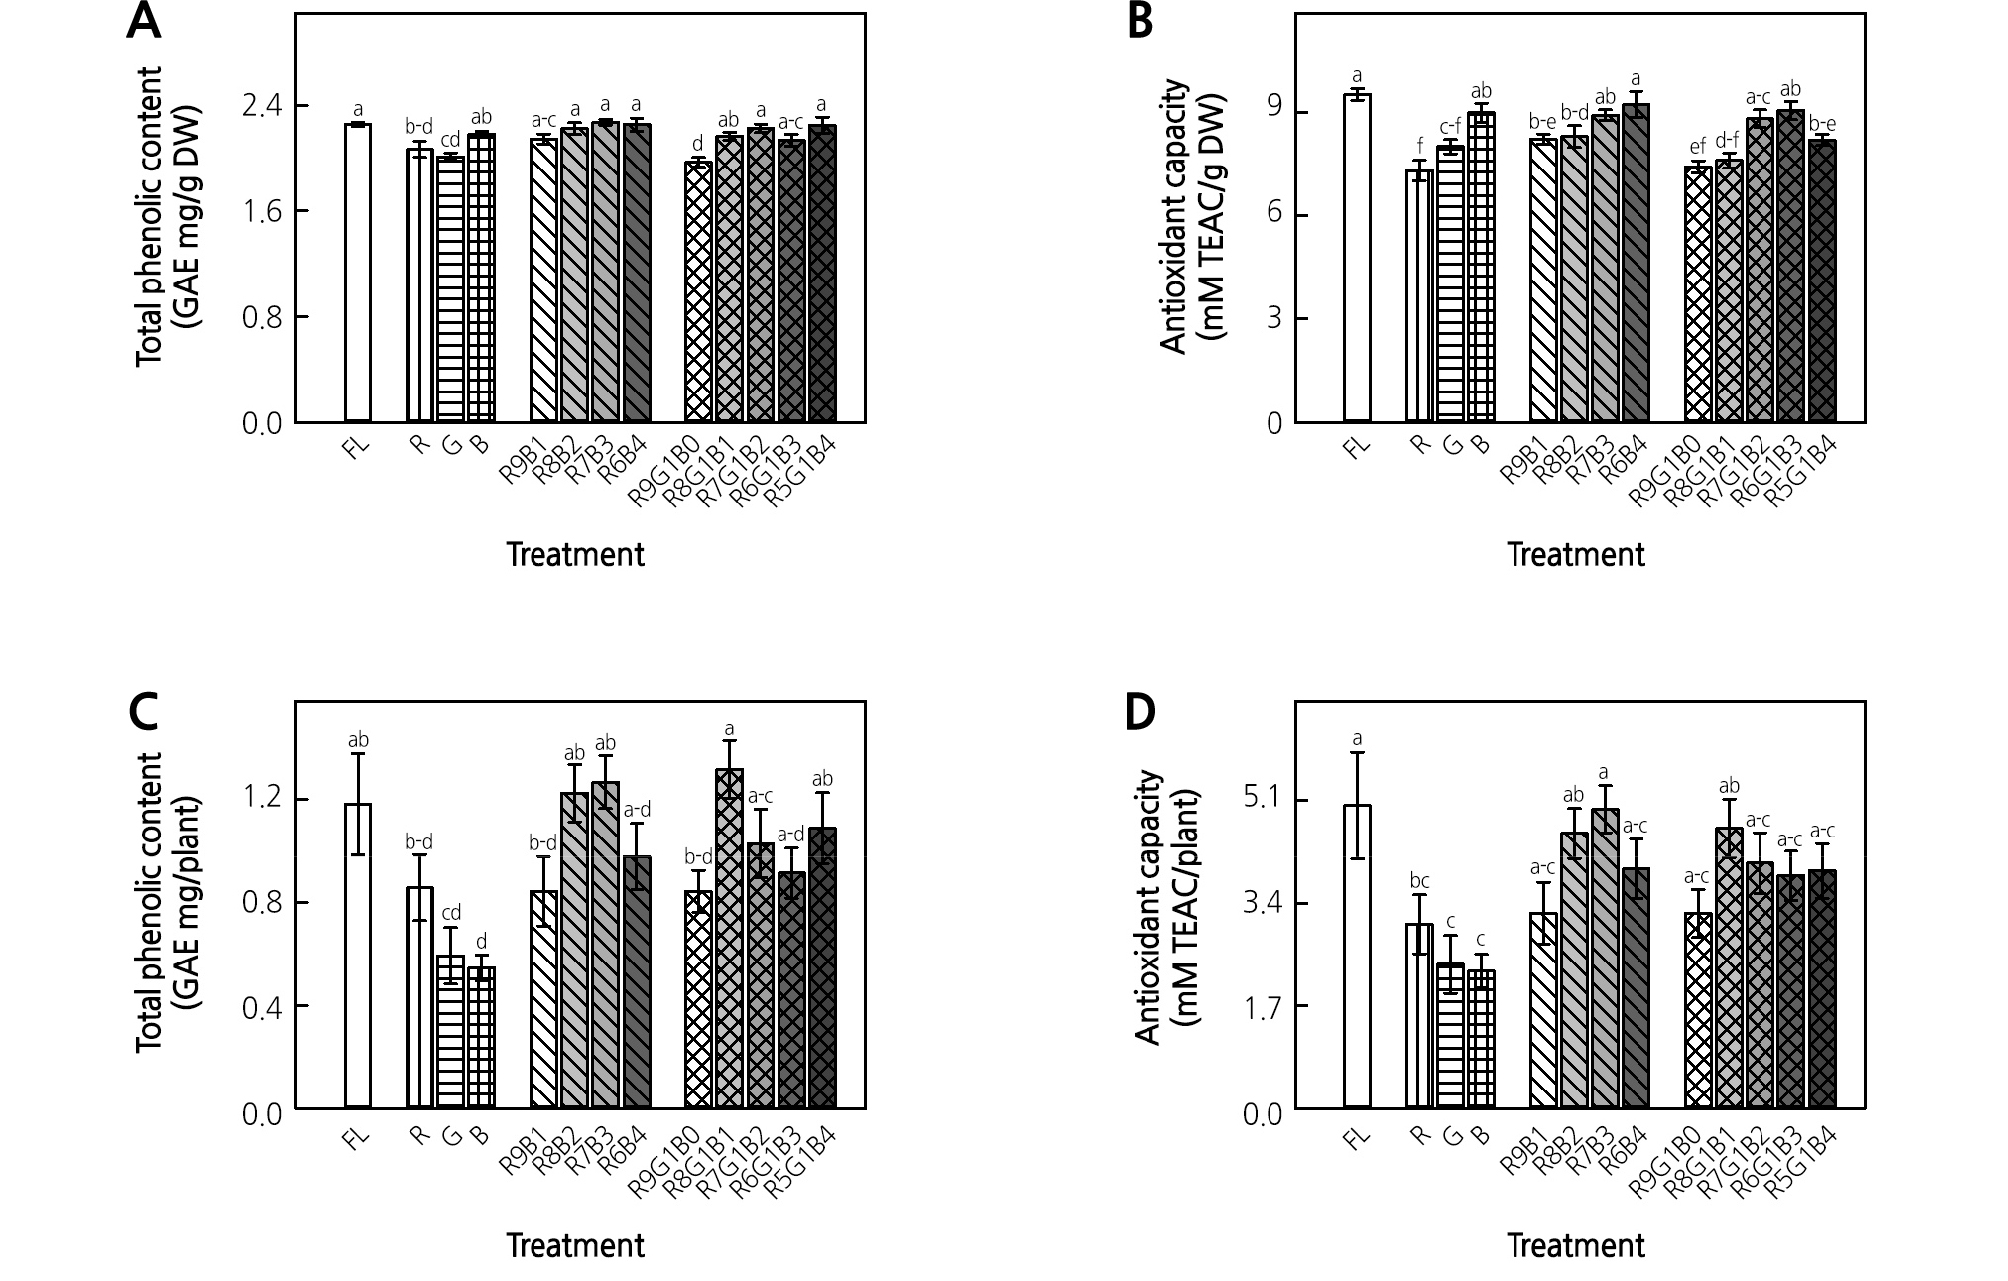
Fig. 5.
Total phenolic content (A, C) and antioxidant capacity (B, D) of ice plant grown under monochromatic and various combined ratios of red (R) to blue (B) and RB with green (G) light-emitting diodes (LEDs) at 4 weeks of treatment. Data indicate the means ± SE (n = 5). Different letters above bars indicate significant differences at p < 0.05.
Discussion
Growth Characteristics
Our results suggest that monochromatic R LEDs effectively induce biomass accumulation and leaf expansion in ice plant (Fig. 2 and Table 2). The positive effects of red light have been reported in many studies (Son and Oh, 2013; Chen et al., 2014; Jeon et al., 2017; Rabara et al., 2017). However, as the ratio of R LEDs increased, shoot fresh weight and leaf area did not correspondingly increase in the RB and RGB treatments. These responses appeared to be synergistic effects found with an appropriate ratio of RB and RGB combinations. In this study, the proper proportions of R, G, and B light, such as R8G1B1, more effectively increased the shoot and root fresh weight when compared with the RB treatments. Kim et al. (2016) reported that FL, which includes the G spectrum (550 nm), induces higher plant growth when compared with R + white (W) and RBW LEDs. They suggested that the G spectrum is required to improve the growth of ice plants. It has also been suggested that the leaves of the lower canopy are able to receive transmitted G light, resulting in an increase in light use efficiency (Kim et al., 2004a; Son and Oh, 2015). These researchers found that RB with G treatments promoted lettuce (Lactuca sativa L.) biomass more than did RB treatments. Therefore, in the case of ice plant, a light source including the G spectrum might be important for various growth characteristics.
Specific leaf weight, measured using relative leaf thickness, was higher in the RB and RGB treatments than in plants grown under monochromatic LEDs. In particular, leaf thickness tended to increase with an increasing ratio of B LEDs in the RB and RGB treatments, except in R8G1B1. Liu et al. (2011) and Macedo et al. (2011) reported that B light promotes the formation of mesophyll tissue in leaves. B light also activates the expression of enzymes such as magnesium chelatase, glutamate-tRNA reductase, and ferrochelatase, which regulate chlorophyll synthesis (Wang et al., 2009). The SPAD value of plants grown under monochromatic B LEDs was the highest among the monochromatic LED treatments in the present study (Table 2), which is consistent with those studies. Kim et al. (2004b), Son et al. (2012), and Jeon et al. (2017) also reported similar results for the SPAD value with monochromatic B LEDs. The positive effects of B LEDs on chlorophylls were increased in RB or RGB combination treatments with 30 - 40% B LEDs when compared with the monochromatic B LED treatment. Kim et al. (2016) also reported that B LEDs with R and W LEDs (RWB) induced higher SPAD values in ice plant when compared with FL and RW LEDs.
Photosynthetic Rate
In the present study, R LEDs produced the highest photosynthetic rate among the monochromatic LED treatments (Fig. 4). Photosynthetic pigments, such as chlorophyll a and b, absorb light at R and B wavelengths; in particular, R wavelengths have better absorption efficiency than do B wavelengths. Therefore, the photosynthetic rate decreased as the ratio of R LEDs decreased in the RB and RGB treatments in this study. G light has been known to have higher reflectance and transmittance than do R and B light; so, it is not as effective for photosynthesis (Talbott et al., 2002; Terashima et al., 2009). Our results also showed that G LEDs resulted in a significantly low photosynthetic rate among the monochromatic LED treatments. However, the RB with G treatments containing 6 - 7% G LEDs resulted in a maximum 28% higher rate than that of the RB treatments. Because G light can easily penetrate the canopy, lower canopy leaves unable to receive direct visible light, such as R and B light, use the transmitted G light in photosynthesis (Klein, 1992; Nishio, 2000; Terashima et al., 2009).
Photosynthetic rates are generally related to the accumulation of biomass; so, they usually exhibit similar trends. However, our results did not show this similarity. The reason for this might be that the photosynthetic rate measurement was conducted using a portion of the leaves, not the whole plant, and the measurement time was very short; so, the measured photosynthetic rate did not reveal a direct relation with the accumulated biomass.
Total Phenolic Content and Antioxidant Capacity
Phenolic compounds with antioxidant properties are known to have multiple beneficial effects in plants, as well as in human health (Bautista et al., 2016). The total phenolic content and antioxidant capacity of ice plant was highest in the B LED treatment among the monochromatic LED treatments (Fig. 5A and 5B). Kim et al. (2016) also reported that the B spectrum (460 nm) enhances the total phenolic content and antioxidant capacity in ice plant. Many studies have reported that B light increases health-promoting compounds and radical-scavenging activity in tissue-cultured plantlets, fruits, and vegetables (Xu et al., 2014; Qian et al., 2016). Kubasek et al. (1992) reported that B light and UV-A light, which have the same photoreceptor, stimulate phenylalanine ammonia-lyase (PAL) and chalcone synthase (CHS), the key enzymes of flavonoid biosynthesis. In the present study, the RB and RGB treatments showed a tendency toward increasing antioxidant capacity with an increasing ratio of B LEDs. When we converted total phenolic content or antioxidant capacity per dry weight into total phenolic content or antioxidant capacity per plant, the results were primarily dependent on the biomass of the shoots (Fig. 5C and 5D). The control was also considered to be suitable lighting for ice plant cultivation, because plants in the control showed biomass similar to that found in the R8B2, R7B3, and R8G1B1 treatments. Although FL with wide visible spectrums are inexpensive and are commonly used to cultivate crops indoors, it is better to use LEDs than FL for profitable cultivation in plant factories. Electricity is an important factor in plant factories, and accounts for about 25 - 30% of production costs (Kozai et al., 2016). Son et al. (2016) found that LEDs are superior to FL in terms of total power consumption, as well as light use efficiency and power savings.
Taken together, these results show the response of ice plant to a variety of visible light spectrums and indicate the appropriate light conditions for cultivation of ice plant in plant factories. With regard to ice plant growth and bioactive compound production, the optimum light quality for cultivation in plant factories with artificial light was provided by LED ratios of R82B, R7B3, and R8G1B1, or by FL. These insights on LED lighting will lead to a greater understanding of the effects of spectral quality on growth and secondary metabolite production in ice plant.
