

Introduction
Materials and Methods
Plant Materials and Growth Conditions
White LED Lights
Growth Characteristics
Canopy Net Photosynthetic Rate
Saponin Content
Ginsenosides Content
Light Use Efficiency
Statistical Analysis
Results
Growth Characteristics
Saponin and Ginsenosides Content
Light Use Efficiency
Discussion
Growth Characteristics
Saponin and Ginsenosides Content
Light Use Efficiency
Conclusion
Introduction
Vertical farms require efforts to reduce costs due to the high initial investment and operational expense required, and doing so can secure their competitiveness. Especially in the case of vertical farms, the high electricity cost for lighting (34%) is the main cost burden in these businesses, and this expense is increasing (Kozai, 2018). Choosing the best light for crop production with the lowest energy consumption is essential to reduce this cost burden (Nozue et al., 2017). Fluorescent lamps were predominantly used in early vertical farms, but the use of light-emitting diode (LED) has become widespread due to their benefits, including highly efficient energy use, cost-effectiveness, long lifetimes, different color options, and low radiated heat (Kozai, 2018). Most studies of lighting systems focusing on vertical farms are investigations of the plant morphology, crop yield and quality under various LED-based combinations red and/or blue and/or green light (Shimizu et al., 2011; Kim and You, 2013; Son et al., 2016a; Si et al., 2024). In addition, white LED have been widely used in both research and commercial vertical farms in recent years given that their broad spectrum can promote crop growth and better yields, with phosphor conversion technology making them easy to manufacture at a reduced cost (Yang et al., 2020; Lee and Nam, 2023).
Light source parameters such as the spectral photon flux distribution, photosynthetic photon flux, color temperature, and color rendering of light can be indicators that aid in the selection of the most appropriate white LED for crop production in a vertical farm (Han et al., 2017; Kárász and Kopják, 2020; Fujiwara, 2022). Among them, the correlated color temperature (CCT) and color rendering index (CRI) parameters represent the lighting performance of white LED (Jargus et al., 2019; Nam, 2002). CCT refers to the numerical presentation of the color and is measured on the scale of Kelvin degrees, with perfect black color set to 0 (‒273°C) as the reference value. The range of 3,000 K or less is a yellow-based light source, classified as warm white, and the ratio of wavelengths excluding blue light (B) is relatively high. Light sources above 4,000 K, such as a fluorescent lamp, emit cool light because the B ratio is high, and a value exceeding 8,000 K indicates a clear blue light source. CRI is a numerical index for light sources that reveals the true color of an object to the observer. It is measured on a scale from 0 to 100 (Bispo-Jr et al., 2021). The CRI value of natural sunlight is 100, and a high CRI of a light source indicates that the light from the source is closer to natural light (Nam, 2002). Several studies have sought to compare plant growth outcomes according to the CCT and CRI of different white LED treatments. Yang et al. (2020) reported that the light spectrum of white LED with lower CCT and higher CRI values improved the growth of pak choi. Also, the fine tuning of white LED with increasing CCT and CRI values was shown to improve strawberry transplant production levels (Lee et al., 2023b).
Normally, the ginseng cultivation period is four to six years, and it is impossible to repeat cultivation. Production yields of ginseng have declined since the spread of soil-borne diseases (Xiao et al., 2016). Ginseng sprouts have a short cultivation period and are harvested from the whole plant (shoot and root), containing high ginsenosides content (Chang et al., 2020). Korean ginseng is a well-known commercial medicinal crop, and many studies have attempted to produce ginseng sprouts in vertical farms (Park et al., 2019; Lee et al., 2022; Lee et al., 2023a). In this study, several types of white LED with different CCT and CRI values were used to investigate the effects on the growth, canopy net photosynthetic rate (Pn), and the content of bioactive compounds, specifically saponin and ginsenosides, of ginseng sprouts in a vertical farm module. Additionally, we selected the best white LED considering the light use efficiency (LUE) of each type of white LED based on growth and bioactive compounds.
Materials and Methods
Plant Materials and Growth Conditions
One-year-old spring ginseng seedlings were purchased from a farm (Brother Sprout Ginseng Farm, Namyangju, Korea). The seedlings were transplanted into a plastic tray (27 × 58 × 8 cm; L × W × H) filled with exclusive ginseng media (Shinsung Mineral Co., Ltd., Seongnam, Korea) in a vertical farm. The following growth conditions before foliation were maintained for two weeks: an air temperature of 15°C and relative humidity of 70%. Subsequently, the seedlings were cultivated at an air temperature of 23°C and relative humidity of 60% along with 400 µmol·mol-1 of CO2 for three weeks. During the experiment, a nutrient solution (National Institute of Horticultural and Herbal Science; 500 mL, electrical conductivity 0.8 mS·cm-1, pH 5.5) (Yu et al., 2016) for ginseng sprouts was supplied to the bottom of the tray every three to four days.
White LED Lights
Three types of white LEDs, cool white (CW), natural white (NW), and warm white (WW) (Bissol LED, Seoul, Korea), were used as treatments, and fluorescent lamps (FL; HYG-FPL 36 WR; Nam Yung, Seoul, Korea) were used for the control group. The light spectrum and chromaticity diagram of each light treatment are presented in Fig. 1. In addition, the notations and measured CCT; the photosynthetic photon flux density (PPFD); the fractions of red (R), green (G), and blue (B); the ratio of R to B; and the CRI of each light treatment are provided in Table 1. The durations of all light treatments were 16 h per day. The entire cultivation area (54 × 58 cm; L × W) was divided into six parts for the individual light treatments. A spectroradiometer (JAZ-EL 200, Ocean optics, Dunedin, FL, USA) was used to measure the light spectra at the plant canopy level, and the average PPFD value was set to 80 µmol·m-2·s-1. To maintain the distance from the light source to the plants, as the height of the ginseng sprouts increased, the light source was adjusted. The ginseng sprouts were rotated every one to two days to ensure uniformity of the light distribution.

Table 1.
Correlated color temperature (CCT), fraction of photosynthetic photon flux density (PPFD) and color rendering index (CRI) of the three types of white LEDs
| Treatmentz | CCT (K) |
PPFD (µmol·m-2·s-1) | PPFD (%) |
R/B ratio |
CRI (Ra) | |||
|
Red (700–600 nm) |
Green (600–500 nm) |
Blue (500–400 nm) | ||||||
| Notationy | Measured | |||||||
| FL | 6500 K | 6017 K | 79.7 | 28 | 44 | 28 | 1.00 | 65.27 |
| CW | 8500 K | 7948 K | 80.6 | 21 | 48 | 31 | 0.65 | 62.25 |
| NW | 5000 K | 4828 K | 80.3 | 29 | 48 | 23 | 1.28 | 72.03 |
| WW | 2700 K | 2542 K | 80.3 | 49 | 43 | 8 | 6.00 | 74.43 |
Growth Characteristics
The growth characteristics were measured five weeks after transplanting. Shoot and root of the ginseng sprouts were obtained by cutting the rhizome site, and the fresh weight in each treatment was measured with an electronic weighing scale (Si-234, Denver Instrument, Bohemia, NY, USA). The shoot/root (S/R) ratio was calculated by dividing the shoot fresh weight by the root fresh weight. The stem length from the top of the rhizome to the point of the stem split was used as the standard for the stem and was measured using a ruler. The leaf area was determined by an area meter (LI-3100C, LI-COR, Lincoln, NE, USA).
Canopy Net Photosynthetic Rate
After four weeks of transplanting, the ten of ginseng sprouts were used to measure the Pn with a closed-type assimilation chamber method (Fig. 4B). The acrylic assimilation chamber used here (52 × 51 × 46 cm; L × W × H) was placed and moved under each light treatment in the vertical farm. Inside the chamber, a CO2/H2O analyzer (LI-850, LI-COR, Lincoln, NE, USA) was set up to measure changes of the CO2 concentration by photosynthesis. A temperature and relative humidity (RH) sensor (STL STHS, STA Corporation, Anyang, Korea) was installed inside the chamber, and all data were recorded and monitored by a logger (CR1000, Campbell Scientific, Logan, UT, USA) every five seconds. A fan (Fan 44 mm, Pengda Technology, Shenzhen, China) was also installed inside the chamber for air circulation. At the top of the plant canopy, the PPFD was set to 80 µmol·m-2·s-1. The light source was identical in each light treatment. The Pn of the ginseng sprouts was calculated according to changes in CO2 (∆CO2)·plants-1·s-1.
Saponin Content
Five weeks after transplanting, the ginseng sprouts were harvested and then freeze-dried (Alpha 1–4 LSC plus, Martin Christ Co., Osterode, Germany). All samples were pulverized using a mill (Tube mill control, IKA, Wilmington, NC, USA). The dried powder (100 mg) was mixed with 5 mL of 1-butanol (99.8%, v/v) and incubated for 24 h at 4°C. Thereafter, the samples were sonicated (at 50°C for 60 min) (SK5210HP, Hangzhou Nade 144 Scientific Instrument, Zhejiang, China) and centrifuged (at 2,195 × g, at 4°C for 15 min). Using a nitrogen evaporator (N-EVAP 111, Organomation, Berlin, MA, USA), the supernatant of each centrifuged sample was evaporated and dissolved with 5 mL of MeOH (99%, v/v). The total saponin content was analyzed using a modified version of the method in Hiai et al. (1976). The standard curve was acquired using ginsenosides Re (ASB-00007210-005, ChromaDex, Los Angeles, CA, USA). The saponin content of the ginseng sprouts was presented in milligrams (mg) of saponin per gram (g) of dry weight.
Ginsenosides Content
The dried powder (45 mg) was subjected to extraction in a sonication water bath with 4.5 mL of 80% ethanol for 1 h. The extraction process was identical to a method described in Kim et al. (2020). The ginsenosides content was measured with a high-performance liquid chromatography system (YL9100, Youngin Chromass, Anyang, Korea) equipped with a C18 column (4.6 × 250 mm, 5 µm, Chromex Scientific, Dronfield, UK), and the absorbance (at 203 nm) levels were detected by a UV/VIS detector (YL9120, Youngin Chromass, Anyang, Korea). The flow rate of the mobile phase was 0.6 µL·min-1, the injection sample volume was 20 µL, and the column temperature was maintained at 35°C. Solvents were 100% acetonitrile (A) and deionized water (B). The total run time for each sample was 70 min, and the ginsenosides were separated by gradient elution (0–10 min, 70% B; 10–50 min, 70–60% B; 50–55 min, 60–20% B; 55–61 min, 20–80% B; 61–70 min, 80–70% B). Ginsenosides of protopanaxadiol (PD; Rb1, Rb2, Rc, and Rd) and protopanaxatriol (PT; Rg1, Rg2, Re, and Rf) were obtained from ChromaDex (ChromaDex, Los Angeles, CA, USA).
Light Use Efficiency
Power consumption was calculated according to the current and voltage values using a digital multimeter (Fluke-115, Fluke, Everett, WA, USA). Total power consumption in individual lights was calculated by multiplying the number of LED chips, the power consumption, the light period, and the cultivation period (Son et al., 2016b). The LUE based on growth was calculated by dividing the total dry weight of ginseng sprouts by the total power consumption during the growth period. LUEs based on total saponin and total ginsenosides content were also calculated using the same method. LUEs were expressed as mg dry weight of ginseng sprouts per watt (W), mg saponin content per W, and mg ginsenosides per W.
Statistical Analysis
Growth characteristics were measured in 35 replicates for each treatment and the Pn was measured in four replicates. Ten replicates created by combining 30 samples of dried powder per treatment were used to measure the saponin and total ginsenosides content. An analysis of variance was conducted using statistical analysis software (9.2 Version, SAS Institute, Cary, NC, USA). Tukey's test was used to verify significant differences in light treatments at a significance level of p < 0.05.
Results
Growth Characteristics
The shoot fresh weight in WW was significantly higher than those of the FL and CW, and it was 1.3 times higher than FL (Fig. 2A). CW resulted in the lowest root fresh weight, and there were no significant differences among the other LED treatments (Fig. 2B). The shoot fresh weight was 1.3 times higher than the root fresh weight on average for all light treatments; therefore, the trend of the total fresh weight was identical to that of the shoot growth. The total fresh weight in WW was 1.2 times higher than in the FL (Fig. 2C). The total fresh weight of NW was significantly higher than that of the CW treatment, but there were no significant differences with FL. The S/R ratio was highest in WW and all treatments has values that exceeded 1 (Fig. 2D).

Fig. 2.
Shoot fresh weight (A), root fresh weight (B), total fresh weight (C), and shoot/root (S/R) ratio (D) of ginseng sprouts grown under fluorescent lamps (FL), cool white (CW), natural white (NW) and warm white (WW) LEDs for five weeks. Different letters indicate significant differences at p < 0.05 (n = 35). The dashed line in D indicates a S/R ratio of 1.
The leaf area in the WW and NW treatments was significantly higher than those in the FL and CW (Fig. 3A). Also, the highest value, found for WW, was 1.4 times higher than that of FL. The stem length of WW was significantly higher, at 1.2 times, than in the FL treatment. There were no significant differences in the stem length among the FL, CW, and NW treatments (Fig. 3B). Differences in the leaf area and stem length among the light treatments were clearly revealed by the appearance of ginseng sprouts (Fig. 3C). Pn was not significantly different among the treatments, but the values were higher in the following order: WW > NW≥ FL > CW (Fig. 4).


Saponin and Ginsenosides Content
The saponin content per shoot dry weight was highest in FL and lowest in WW (Fig. 5A). The saponin content per root dry weight showed a trend opposite to that of the shoot dry weight. The saponin content relative to the root dry weight was significantly higher in NW and WW than in FL and CW (Fig. 5B). The saponin content for the whole plant was significantly higher in NW and WW than in CW, and NW and WW showed approximately 1.2 times higher saponin content in the whole plant compared to the FL treatment (Fig. 5C).

Fig. 5.
Saponin content of shoot (A), root (B) and whole ginseng sprouts (C) grown under fluorescent lamps (FL), cool white (CW), natural white (NW) and warm white (WW) LEDs for five weeks. Different letters indicate a significant difference at p < 0.05, and capital letters indicate a significant difference in the total saponin content (n = 10).
The total ginsenosides content per unit shoot dry weight was the significantly highest in FL among all treatments, and there were no significant differences among the white LED treatments, which showed a trend similar to that of the shoot saponin content (Table 2, Figs. 5A and 6). The content of Rb1, Rc, Rg1, Re, and Rf in the shoot were not affected by the white LED treatments, and the content of Rb2, Rd, and Rg2 were lowest in NW (Table 2). The ginsenosides content results for the shoot and root dry weights showed a similar trend (Tables 2 and 3). The total ginsenosides content of the root dry weight was significantly highest in the FL, and the NW led to the lowest values among all treatments (Table 3). The ratio of panaxadiol (PD) to panaxatriol (PT) for the shoot was higher than that of the root, and there were no significant differences in this ratio among the treatments. The total ginsenosides content of the whole plant was significantly higher in WW and FL than in CW and NW; there was no significant difference between WW and FL, but WW showed a higher value than FL and a higher value by 1.3 times compared to CW (Fig. 6).
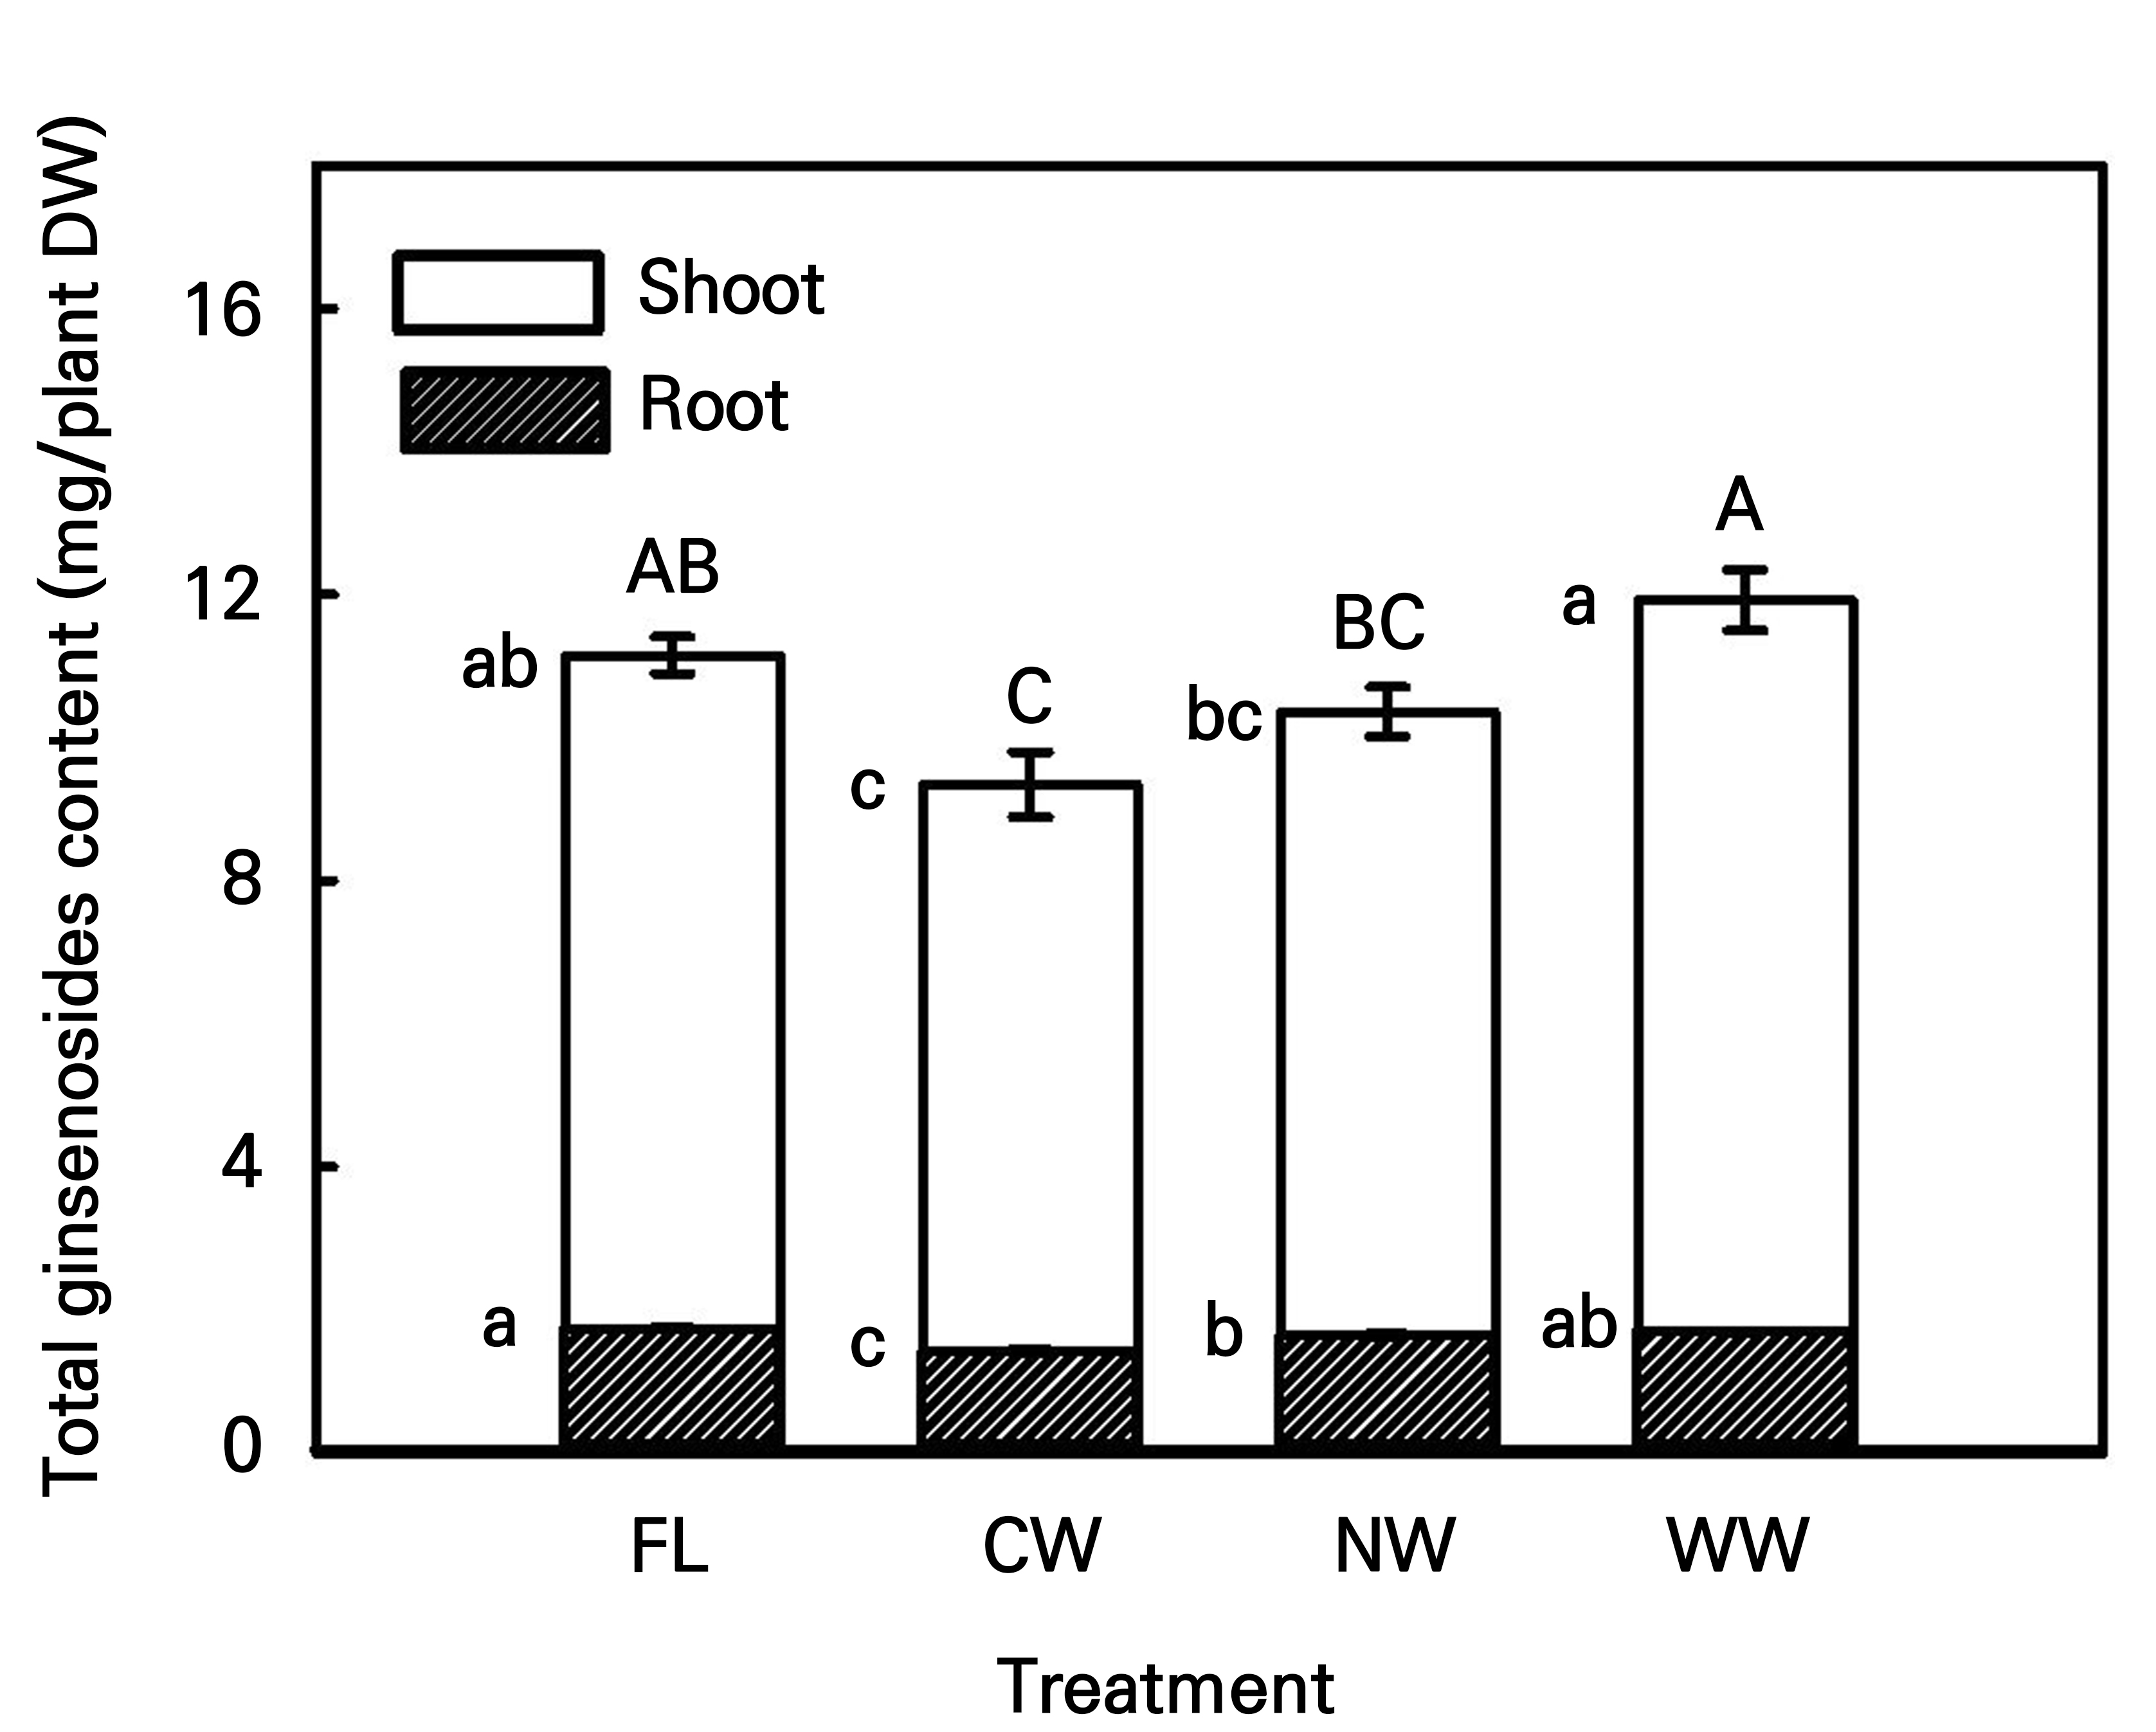
Fig. 6.
Total ginsenosides content of ginseng sprouts grown under fluorescent lamps (FL), cool white (CW), natural white (NW) and warm white (WW) LEDs lights for five weeks. Different letters indicate a significant difference at p < 0.05, and capital letters indicate a significant difference in the total ginsenosides content (n = 10).
Table 2.
Ginsenosides content of shoot in ginseng sprouts grown under three types of white LEDs for five weeks
| Ginsenosides content of shoot (mg/g DW) | |||||||||||
| Treatmentz | Panaxadiol (PD) | Panaxatriol (PT) | Total | PD/PT ratio | |||||||
| Rb1 | Rb2 | Rc | Rd | Rg1 | Rg2 | Re | Rf | ||||
| FL | 4.30 ay | 5.50 a | 0.32 | 15.73 a | 14.97 | 6.42 a | 7.65 a | 0.08 | 54.96 a | 0.89 | |
| CW | 3.25 b | 4.60 b | 0.30 | 13.27 b | 14.05 | 5.49 b | 5.52 b | 0.07 | 46.54 b | 0.85 | |
| NW | 2.96 b | 3.48 c | 0.32 | 10.44 c | 14.22 | 4.26 c | 5.45 b | 0.07 | 41.21 b | 0.72 | |
| WW | 3.04 b | 4.25 b | 0.33 | 11.57 bc | 14.27 | 4.99 bc | 4.89 b | 0.10 | 43.45 b | 0.79 | |
Table 3.
Ginsenosides content of root in ginseng sprouts grown under three types of white LEDs for five weeks
| Ginsenosides content of root (mg/g DW) | |||||||||||
| Treatmentz | Panaxadiol (PD) | Panaxatriol (PT) | Total | PD/PT ratio | |||||||
| Rb1 | Rb2 | Rc | Rd | Rg1 | Rg2 | Re | Rf | ||||
| FL | 0.97 | 0.88 by | 0.39 | 0.56 a | 3.79 a | 0.65 a | 1.28 a | 0.38 a | 8.90 a | 0.46 | |
| CW | 0.93 | 0.78 c | 0.39 | 0.50 b | 3.59 b | 0.59 b | 0.80 b | 0.30 b | 7.88 bc | 0.49 | |
| NW | 0.86 | 0.93 b | 0.33 | 0.46 b | 3.59 b | 0.55 c | 0.79 b | 0.28 bc | 7.78 c | 0.49 | |
| WW | 0.91 | 1.06 a | 0.37 | 0.46 b | 3.76 ab | 0.61 b | 0.78 b | 0.26 c | 8.21 b | 0.52 | |
Light Use Efficiency
Total power consumption showed the highest value in the FL, and power savings compared to FL was high in the order of WW, NW, and CW (Table 4). In addition, LUEs based on the plant biomass, saponin content, and ginsenosides content per 1 W were higher in all white LED treatments than in the FL and were in the order of WW, NW, and CW. Specifically, the LUEs of the plant biomass, saponin content, and ginsenosides content in WW were correspondingly 5.1, 5.0, and 1.4 times higher than that of FL.
Table 4.
Total power consumption and light use efficiency for the three types of white LEDs
| Treatmentz |
Total power consumptiony (kW) |
Power savings compared with control (%) | Light use efficiency (DW mg/W) | ||
| Plant DW | Saponin content | Ginsenosides content | |||
| FL | 105 | 0 | 173.05 | 11.93 | 5.31 |
| CW | 41 | 60.95 | 421.91 | 28.58 | 5.84 |
| NW | 39 | 62.86 | 535.40 | 37.24 | 6.48 |
| WW | 25 | 76.19 | 874.80 | 59.27 | 7.45 |
Discussion
Growth Characteristics
The shoot growth of ginseng sprouts is an important factor, as the whole plant is consumed. In this experiment, as the R/B ratio increased in the white LEDs, the shoot fresh weight, leaf area, stem length, and Pn all increased, with WW showing the highest values among the treatments. Also, previously we reported that the shoot fresh weight, stem length, and the Pn value of ginseng sprouts increased under a high ratio of R among various RGB combinations of LEDs (Kim et al., 2020). These results were consistent with those in previous studies finding that R light has a higher LUE than other visible light bands, eventually leading to the promotion of growth-related parameters such as the plant biomass, stem length, and Pn (McCree, 1972; Li et al., 2009; Lee and Nam, 2022). Our results are also meaningful in that a high ratio of R in white LEDs with wide wavelength bands improved the growth and quality of ginseng sprouts. R is the most efficient wavelength to induce Pn in the PAR spectrum, and the effect of R on plant growth support has already been confirmed in many studies (McCree, 1972; Inada, 1976). Additionally, the high ratio of R in white LEDs appears to show a similar effect. In a study by Cope and Bugbee (2013) that compared the growth and development of radish, soybean, and wheat under warm, neutral, and cool white LEDs at different light intensities, a high R ratio with warm LEDs resulted in enhanced leaf expansion and stem elongation outcomes.
Many studies have used combinations of monochromatic LEDs in a narrow wavelength band based on R, G, and B ratios to evaluate the effect of the quality of light on plant growth (Kim et al., 2004; Kang et al., 2016; Son et al., 2016a). However, because the three types of white LEDs used in this study have a wide wavelength band, there are limitations to using only a RGB-ratio-based analysis to discuss the results. Therefore, we used CCT and CRI parameters, which represent the performance of the lighting source. The attempt to explain plant responses using CCT and CRI for each light source differs from existing RGB-ratio-based analysis approaches (Nozue et al., 2017; Park and Runkle, 2018; Yang et al., 2020). The FL, CW, NW, and WW had a small difference in R, G, and B ratio, but they showed pronounced differences in CCT and CRI as well as the leaf area, stem length, and shoot fresh weight (Figs. 2A, 3 and Table 1). Interestingly, the relationships among CCT, CRI, and the total fresh weight showed that as CCT decreased and CRI increased, the total fresh weight was improved (Fig. 7A). Also, Yang et al. (2020) showed that white LEDs with low CCT and high CRI levels increased plant growth outcomes. However, further studies are needed to gain a better understanding of the effects of changes in CCT and CRI on plant growth results.

Saponin and Ginsenosides Content
Among visible light types, B promotes the biosynthesis of secondary metabolites (Lee et al., 2010; Son and Oh, 2013). In previous studies by the authors, when RGB LEDs with a high level of B in the ratio were irradiated onto ginseng sprouts, the saponin and ginsenosides content of the shoot were significantly improved (Kim et al., 2020). In this study, as the R/B ratio was increased in the white LED treatments, the saponin content per unit shoot dry weight tended to decrease, consistent with the results of our previous studies (Fig. 5). However, FL showed significantly higher shoot saponin content compared to the other white LED light treatments despite the fact that the B ratio in FL was lower than in CW, which limited the overall description of the phenomenon according to different light spectra. The saponin content per unit root dry weight were significantly higher in NW and WW than in FL and CW, which represents a different trend compared to that of the value per gram of the shoot. This was consistent with the results of earlier work which showed that a high proportion of R increased the root saponin content of ginseng sprouts (Kim et al., 2020). The total saponin content per plant were significantly higher in NW and WW than in the other treatments due to the higher biomass levels in the NW and WW (Fig. 3C), and the saponin content of the shoot was 4.2 times higher than that of the root. The difference between the shoot and root saponin content was consistent with previous findings (Kang and Kim, 2016). The trend of the relationships among the total saponin content, CCT, and CRI per plant were identical to that of the total fresh weight, and it was found that a lower CCT value and higher CRI value could more effectively enhance the saponin content (Figs. 5C and 7B).
However, there was no difference in the ginsenosides content according to the R/B ratio. The ginsenosides content per g of root showed high values in the order of FL > WW > CW > NW, differing from the saponin content outcomes (Table 3 and Fig. 5). In the white LEDs, WW showed a significantly higher value of the total ginsenosides content compared to the other two treatments, and the ginsenosides content of the root increased as the ratio of R increased, findings similar to those in earlier work (Kim et al., 2020). However, FL showed a higher value of the ginsenosides content even when the ratio of R was lower than WW, indicating a limited explanation in terms of the light spectrum. In our previous study, the RGB treatment led to a difference in the PD/PT ratio between the shoot and root (Kim et al., 2020). In the present study, the light treatment containing G light changed the PD/PT in the shoot, as the shoot showed a higher rate than the root. The ginsenosides content per plant was higher in WW and FL than in CW because the total fresh weight was highest in WW, and the ginsenosides content relative to the unit shoot dry weight was highest in FL (Table 2 and Fig. 6). In addition, the total ginsenosides content per shoot was 5.8 times higher than this value in the root, consistent with previous studies (Kang and Kim, 2016; Kim et al., 2020). In the white LED treatment, the lower CCT and the higher CRI levels increased the total ginsenosides content, matching the tendency found in the total saponin content (Data not shown).
Light Use Efficiency
In order to increase the light energy and electric use efficiency in vertical farms, it is necessary to use a light source with a high conversion coefficient from electric to photosynthetically active radiation (Yan et al., 2019). The conversion coefficient of FL is approximately 0.25, and that of LEDs is around 0.4 (Kozai, 2013). In our study, the total power consumption in the FL is nearly two times higher than that of the LED light source, and WW was most efficient in terms of power use at about 76% compared to FL (Table 4). In addition, the LUEs for biomass, the saponin content, and the ginsenosides content were high in the order of WW > NW > CW > FL, with WW being the most efficient light source for cultivating ginseng sprouts. WW showed higher efficiency by 5 times for both the fresh weight and saponin content and a higher ginsenosides content by 4.5 times compared to FL.
Conclusion
In a comparison of several types of white LEDs, it was found that an increase in the R ratio had a positive effect on the shoot fresh weight, stem length, and photosynthetic rate, while an increase in the B ratio could effectively enhance the shoot saponin content relative to the dry weight. As a result of analyzing the relationship between the growth characteristics and the saponin content of ginseng sprouts for CCT and CRI, as the CCT decreased and the CRI increased, the growth, saponin content and ginsenosides content all increased. Also, the LUE rates based on the biomass, saponin content, and ginsenosides content were higher in the white LEDs than in the FL. In conclusion, the WW treatment with a lower CCT, higher CRI and the highest R ratio among white LED treatments was most effective for the growth of ginseng sprouts as well as the total saponin content and total ginsenosides content per plant. The results of our study can be applied to the cultivation of ginseng sprouts using white LED as they demonstrated the possibility of selecting light sources using the CRI and CCT values in a commercial vertical farm.
