

Introduction
Materials and Methods
Preparation and Treatment of Apple
Determination of Fruit Quality Attributes and Shelf Life
SPCA
Correlation Analysis (CA)
Data Preprocessing
Structure of BP ANN
Performance of BP ANN
Results and Discussion
Variations in the Quality Attributes under the Four Temperatures
SPCA
Correlation Analysis (CA)
BP ANN Model
Introduction
China is the world’s largest producer of apples (Malus domestica Borkh), contributing nearly 50% of the annual global yield (Li et al., 2020). Proper storage mechanisms that ensure a year-round supply of apples would fundamentally enrich the market and expand the sale volume of the apple industry. However, efficient apple storage challenges many aspects of quality, including color, freshness, aroma, flavor, firmness (texture), and the content of beneficial health substances (Veberic et al., 2010; Ganai et al., 2015; Thewes et al., 2017; Vicent et al., 2018). This deterioration in quality makes the apples less appealing to consumers, resulting in substantial postharvest economic losses (Li et al., 2015).
Previous research used the changes of volatiles in apple fruits during storage to establish models to predict shelf life and make satisfactory conclusions. However, determining the types and levels of volatile organic compounds requires expensive and heavy equipment, making the procedure costly and not scalable (Saevels et al., 2004). Other studies focusing on extending the shelf life evaluated the changes that occur in apple firmness, color, weight, soluble solids content (SSC), total sugars, and ascorbic acid content during storage (Shoakhi and Behmadi, 2015; Lee et al., 2017; Santagata et al., 2018). The above studies reported that the shelf life of apples could be closely related to these indicators, along with other factors, such as cultivar, storage method, and picking time (Yoo et al., 2016; Weber et al., 2017). This study used the ‘Royal Gala’ apple cultivar to examine the changing pattern of apple fruit quality and to generate a shelf life prediction model. To enhance the reliability of our study output, the various parameters of our research data were recurrently measured for three consecutive years, and the experiment was conducted under four gradient temperatures.
Sparse principal component analysis (SPCA) introduces a penalty function to eliminate some elements in the load vector, highlights the main part of the principal component, and effectively extracts valid information for determining quality attributes (Lu and Zhang. 2012; Fu et al., 2017). Currently, SPCA is mainly used to extract key data features from large-scale data, such as spectral and electrical data (Cai et al., 2013; Gui et al., 2018). Few studies use small-scale data for SPCA analysis, such as the quality attributes of food. In this study, the performance of SPCA in extracting small-scale data was tested. Many models can predict shelf life, some of which can only be adopted under specific conditions. For instance, the gray model is only applicable for an isochronous time series and thus is not suitable for data collected at different periodic intervals and different temperatures (Yuan and Chen 2016). The Weibull and Arrhenius equations are temperature limited (Jafari et al., 2017; Yang et al., 2018), meaning that one equation can only predict the shelf life at a specific temperature. Therefore, none of these models establishes a universal prediction model for different temperatures. The artificial neural network based on back propagation (BP ANN) is a flexible mathematical structure that identifies complex nonlinear relationships between input and output datasets (Hsu et al., 1995). BP ANN is currently widely used in food science research, i.e., firmness prediction in fresh-cut green peppers (Meng et al., 2012), population prediction of S. typhimurium in surimi (Qin et al., 2017), cultivar identification of various tea germplasms (He et al., 2007), and inosine monophosphate level prediction in lightly salted silver carp (Shi et al., 2017). ‘Royal Gala’ apple, one of the ‘Gala’ apple cultivars, ripens during the offseason of apple fruits, which effectively makes up for the gap in the early apple market (Liu et al., 2002; Fan et al., 2009). Due to the successful application of the BP ANN model on research involving food materials, the ‘Royal Gala’ apple cultivar was employed as a model material to investigate shelf life capacity.
This research aimed to evaluate changes in the 11 quality attributes of ‘Royal Gala’ apples and thus develop a universal model for shelf life prediction in ‘Royal Gala’ stored at different temperatures.
Materials and Methods
Preparation and Treatment of Apple
‘Royal Gala’ apples were harvested from a commercial orchard in Shanxi Province of China (108°15'E; 34°23'N) in mid-August in 2016, 2017, and 2018, respectively. Bagged fruit of uniform size and color and free of disease and injury were picked, transported back to Northwest A&F University (about a 1-hour trip), and stored at 0°C overnight (about 12 h) to lose field heat. Then, the fruits were randomly separated into four groups and stored at 0, 5, 15, and 25°C under 85% to 90% relative humidity. Since the variation rate of quality traits was positively correlated with temperature, the sampling interval is usually arranged consistent with the changes in observation indexes. Therefore, a shorter sampling interval was arranged for the higher-temperature groups and a longer interval for the lower-temperature group. During storage, 12 fruit in each group were sampled at periodic intervals of 12 d at 0°C, 9 d at 5°C, 6 d at 15°C, and 3 d at 25°C. The experiment was conducted for three consecutive years under the same environment conditions, which was regarded as three independent biological repetitions.
Determination of Fruit Quality Attributes and Shelf Life
A colorimeter (CR-400, Minolta, Tokyo, Japan) was used to measure the color value of ‘Royal Gala’ apples according to the manufacturer’s instructions. First, whiteboard calibration was done and then the five even points of the fruit's equator were measured. L* (lightness), a* (red-green), and b* (yellow-blue) values were read directly from colorimeter. Meanwhile, △E (total color difference) and C* (saturation) values were calculated according to Eqs. (1) and (2), respectively.
where L0, a0, and b0 refer to the color values at 0 d.
The fresh weight was measured with a digital scale (JH1200, Jingheng, Beijing, China). The fruit were weighed at 0 d and on each sampling day during the storage period, and weight loss rate (%) was calculated according to Eq.3.
where W1 is the weight at 0 d, and W2 is the weight on each sampling day.
Fresh fruit firmness was determined by a penetrometer device (GY-3, Ruiyou, Aldo Brue, Italy) with an 8-mm probe; for each apple, we sampled three points evenly distributed along the equatorial plane and then peeled off a 1 × 1 cm2 piece of skin to measure the firmness of the fruit pulp. We recorded the average value of three points, and firmness was expressed in Newtons, N. The juice from the sample was squeezed out with a juicer (JYZ-D56, Jiuyang, Xi'an, China), stirred evenly, and then used for the determination of SSC and titratable acidity (TA). The SSC was measured by a hand-held refractometer (WY032T, Sloon, Tianjin, China) according to the manufacturer’s instructions. TA was measured by the acid-base titration method (Ye and Jiang, 2007). The anthrone sulfate method (Qi et al., 2015a) was used to determine the starch content. About 1.5 g of a fresh apple sample was milled with 6 mL of 80% ethanol and then incubated in a water bath (XMTD-8222, Jinghong, Shanghai, China) at 80°C for 30 min to extract soluble sugar. Subsequently, the mixture was cooled and centrifuged (TGL-16G, Antingfeige, Shanghai, China) at 2,000 g for 10 min, and the supernatant was removed (repeated twice). We then mixed the precipitate with 2 mL of deionized water, and it was gelatinized in a boiling water bath for 15 min. After cooling, the starch was mixed with 2 mL of 9.2 mol·L-1 HClO4 for 15 min of acidolysis and then 4 mL of deionized water was added and centrifuged at 2,000 g for 10 min to collect the supernatant. Acidolysis of the remaining precipitate was done again with 2 mL of 4.6 mol·L-1 HClO4 for 15 min and then extracted with 5 mL of deionized water and centrifuged at 2,000 g for 10 min. Subsequently, the supernatants were combined in a 50-mL volumetric flask and deionized water was added up to the mark. Then, 0.4 mL of the supernatant was pipetted, mixed with 5 mL anthrone sulfuric acid, and incubated in a boiling water bath for 10 min, and the absorbance of the mixture was measured at 620 nm (UV-3100, Mapada, Shanghai, China). The starch content was calculated using Eq. (4). The glucose standard stock solution was used to make a standard curve. Three biological samples were determined with two technical repeats on each sampling day.
where C is the amount of glucose in the measuring tube obtained from the standard curve (mg), V is the total volume of the extract (mL), a is the sampling volume during the measurement, and W is the sample weight (mg).
The sensory panel consisted of 10 trained panels to evaluate the overall acceptability of 10 ‘Royal Gala’ apples. The evaluation indicators and weights were reorganized into 40% freshness appearance, 20% taste crispness, 20% sweet and sour palatability, 10% flesh quality, and 10% aroma (Cai et al., 2013). Each indicator was scored on a percentile system, and the weighted average of the five indicators was the score value of each fruit. If the score was less than 60, the fruit is considered to have no commercial value. The shelf life endpoint was considered as the day when 25–50% of the fruit became unacceptable by sensory panels (Varela et al., 2005). The shelf life (day) is the day of shelf life endpoint minus the number of days that the fruit had been stored. The data collected during multiple years of repeated experiments reduce random errors and improve the representativeness of the quality attribute observations. To make the model more universal, the average value from 3 years of repeat quality attribute observations was used for subsequent data processing and analysis.
SPCA
Sparse principal component analysis (SPCA) highlights the main part of each principal component, so the results are more interpretable. SPCA was conducted in RStudio (3.6.2, free and open-source software) using the SPCA function in the elasticnet library. The 11 measured quality attributes (color value, L*, a*, b*, △E, C*, weight loss, firmness, titratable acidity, soluble solids content, starch, and reducing ascorbic acid) and storage temperature were used for the SPCA.
Correlation Analysis (CA)
Correlation analysis (CA) is a powerful tool in multivariate data analysis to find the correlation between two sets of multidimensional variables; many studies have confirmed the validity of CA (Chu et al., 2013; Salinas et al., 2015; Bian et al., 2019). In this research, CA was conducted in RStudio (3.6.2, free and open-source software).
Data Preprocessing
All data were preprocessed using Matlab software (2016b, MathWorks Inc., Natick, MA, USA). Since the dimensions of each indicator differ, parameters with larger values have more impact on the learning of the network, thus slowing the learning speed of the system or even unable to converge. Data were preprocessed by normalization and anti-normalization equations, as shown in Eqs. (5) and (6).
where min is the smallest value of quality attribute X, max is the biggest value of quality attribute X, is the value of the quality attribute X at storage time t, y is the normalized value of , and y’ is the anti-normalization value of x.
Structure of BP ANN
The MatLab (2016b, MathWorks Inc., Natick, MA, USA) BP algorithm toolbox was used to build the network using fruit quality attributes and storage temperature as input and shelf life as the output. The initial weight and threshold were determined by random methods and then continuously optimized through the learning function and learning rate. The optimal number of hidden layer neurons was evaluated by determination coefficients (R2), mean relative error, and relative and percent root mean squares (RMS) of the measured postharvest life and predicted postharvest life. The tansig function was used as the hidden layer activation function, while purelin was the output layer activation function. The learning rate was 0.05, learning step was 2000, performance target value was 0.001, the loss function was MSE, and the MSE function was as shown in Eq. (7). The other parameters were set to default. According to the method described by Gao (2019), the training dataset:validation dataset ratio was set as 3:1. Thus, 44 observations were separated into 33 for training and 11 for validation.
where exp is the experimental value during storage, and pre is the predicted value obtained from the BP ANN.
Performance of BP ANN
Relative percent root mean square (RMS), determination coefficients (R2), and mean relative error were used to evaluate the performance of BP ANN using Eqs. (8), (9), and (10),
where exp refers to the experimental value obtained during storage, pre is the predict value obtained from BP ANN, SSR is the regression sum of squares, and SST is the total sum of squares.
Results and Discussion
Variations in the Quality Attributes under the Four Temperatures
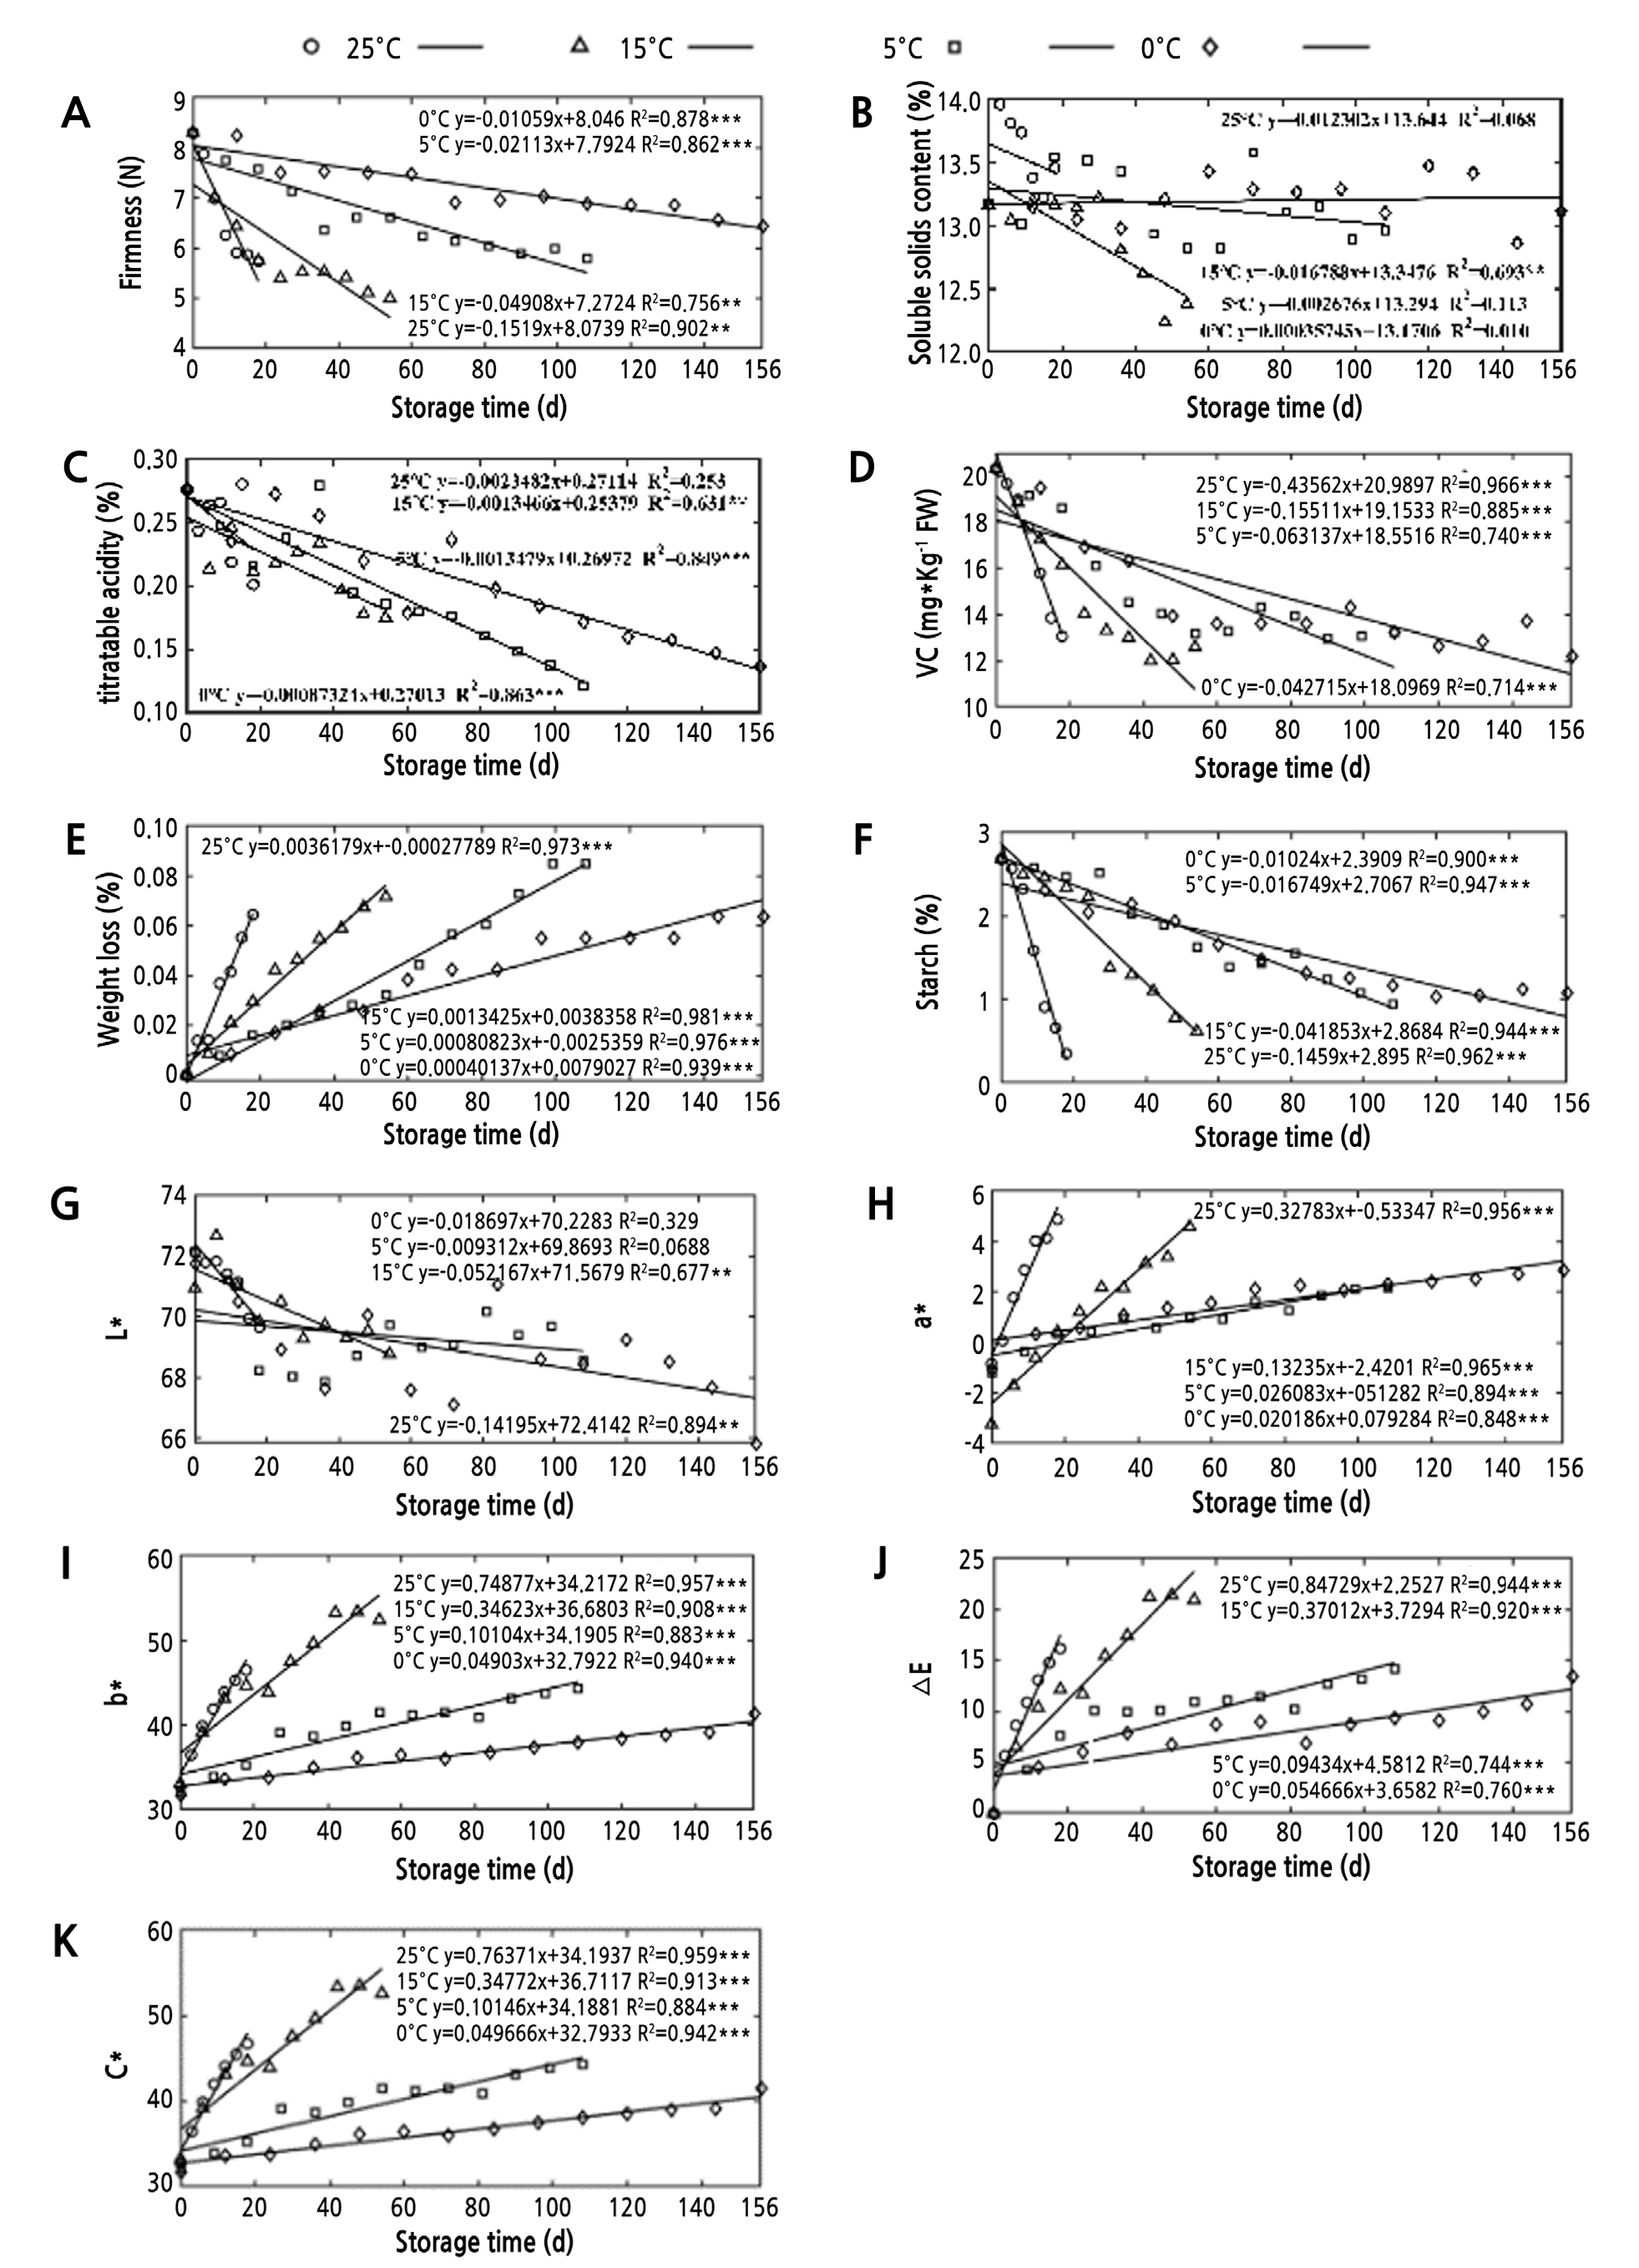
As shown in Fig. 1, five quality indicators, including starch, reducing ascorbic acid, firmness, titratable acidity, and color value L*, reduced with increased storage time. This result suggests that softening and nutrient degradation in the flesh occurred. The brightness of the skin decreased as the storage time increased, resulting in quality deterioration and ripening of the fruit. These physicochemical changes are consistent with previous research (Joanna et al., 2014; Tran et al., 2015). The starch and ascorbic acid (VC) levels of apples are reduced because starch undergoes constant decomposition and conversion into soluble sugars during storage, and VC is easily oxidized under neutral and alkaline conditions (Wijewardane and Guleria, 2009). As a photosynthetic product, starch accumulates in the fruit and is essential for the maintenance of cell turgor (Qi et al., 2015b). Loss of fruit firmness during the postharvest storage of apples is mainly due to the hydrolysis of pectin and cell wall materials in the middle layer, due to the action of cell wall enzymes. Notably, the firmness loss is associated with ethylene-dependent regulation of an α-L-arabinofuranosidase (Zhang et al., 2010a; Storch et al., 2015). TA loss is mainly due to the consumption of acids as a respiratory matrix (Zhang et al., 2010b). Five quality attributes (weight loss, C*, a*, b*, and △E) showed an upward trend with increasing storage time. This result indicates a change in fruit appearance, i.e., tarnishing and yellowing. During fruit storage, the weight typically reduces due to water loss and fruit respiration. Fruit water content is an important indicator of fruit quality. Notably, the loss of huge amounts of water causes fruit shrinkage, which directly affects the appearance, quality, and taste of the fruit. Color value change is mainly due to the gradual decomposition of chlorophyll and an increase in anthocyanin levels during postharvest storage (Song et al., 2019). Gradual changes in fresh weight and color inevitably diminished the consumer acceptability of apples because the quality standards of agricultural products such as apples are primarily determined by their color (Kus et al., 2017). In summary, with the extension of storage time, the quality of apples declined due to changes in quality attributes.
SPCA
Table 1 shows the partial loading matrix obtained by SPCA. Loadings of some quality attributes were 0, indicating that they were negligible in constructing principal components. Other characteristics with non-zero loadings mainly appeared in the first three sparse principal components (SPCs), and these attributes were mostly physicochemical indicators. The non-zero loadings of the first sparse principal component (SPC1) included reduced ascorbic acid, starch, weight loss, and △E (total color difference). The non-zero loading of the second sparse principal component (SPC2) was storage temperature. The non-zero loading of SPC3 was SSC, and the loadings of each quality attribute in the remaining three SPCs were 0. The quality attributes with non-zero loadings were the result of dimensionality reduction obtained after SPCA and could be used as input of BP ANN (D2) to predict the shelf life of ‘Royal Gala’.
Table 1.
Partial loading matrix of the SPCA of 11 quality attributes and storage temperature. SPC represents sparse principal component; the loads from SPC6 to SPC12 are all 0
Correlation Analysis (CA)
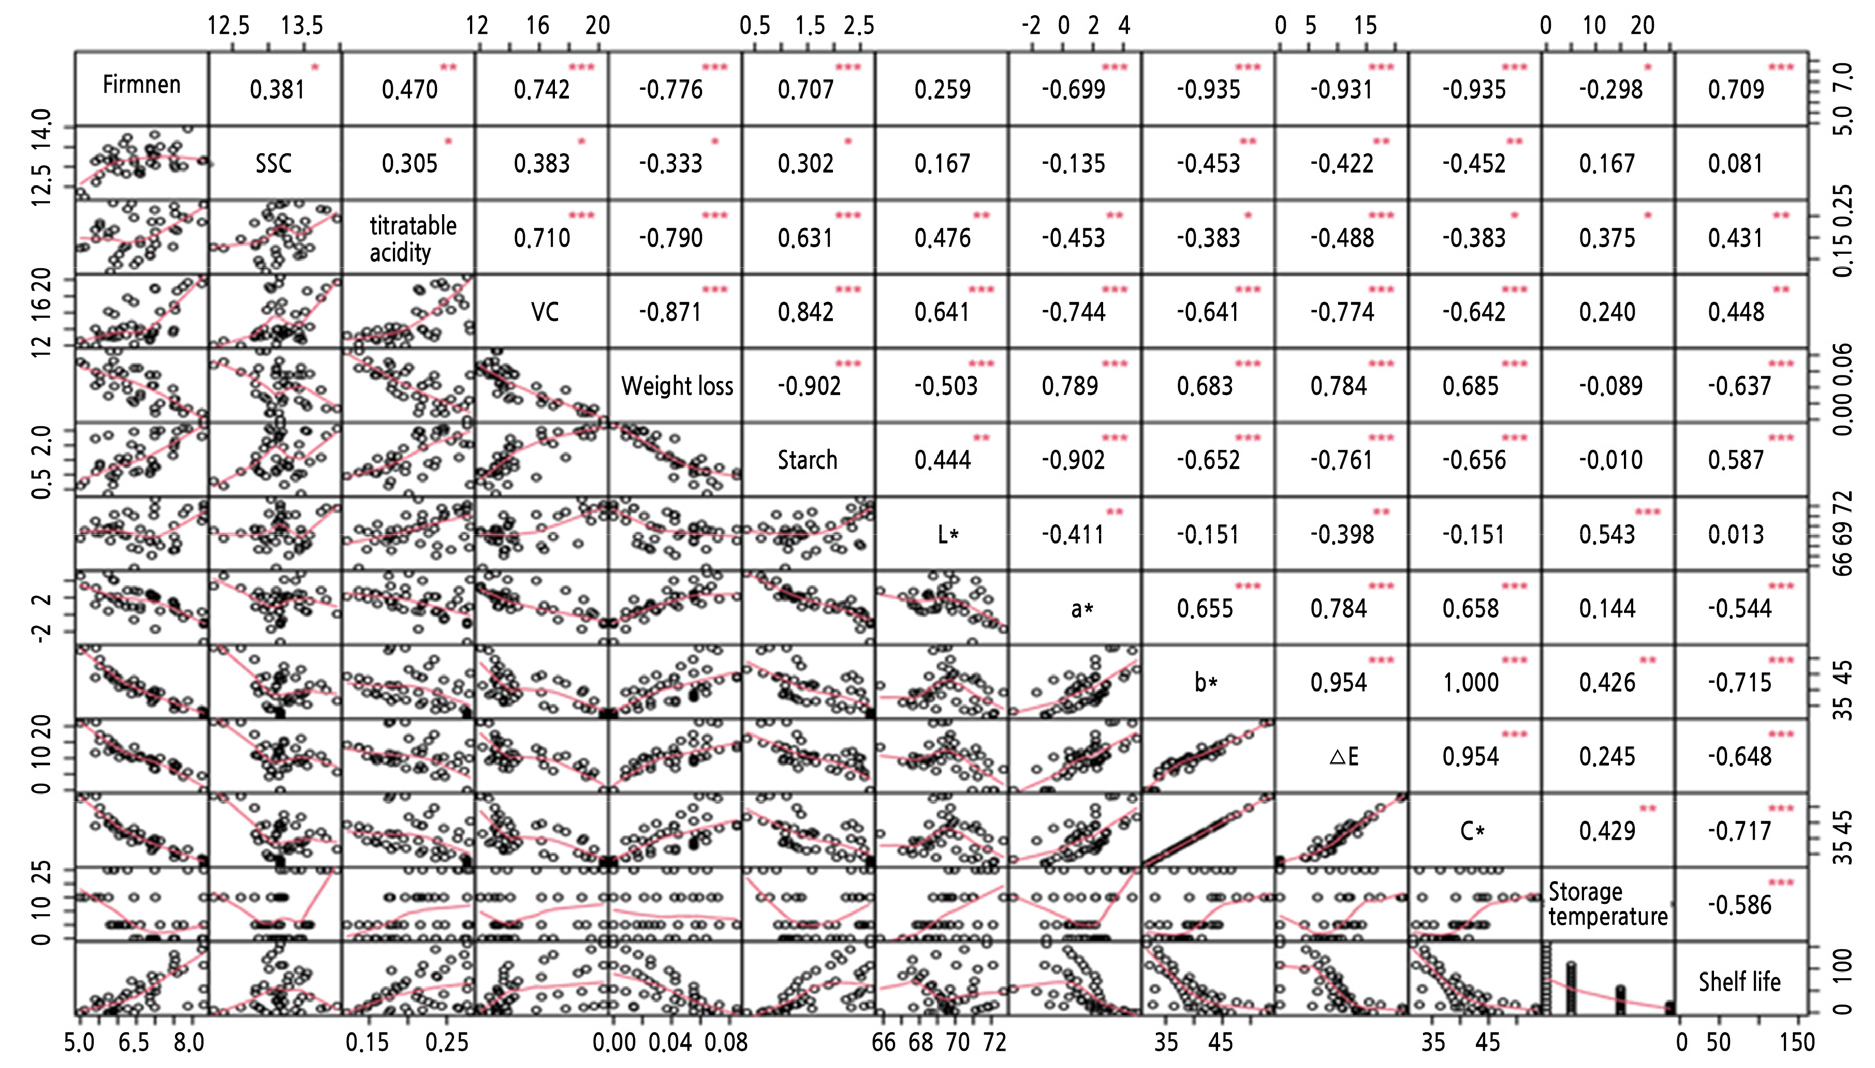
Fig. 2 presents the CA results between the different variables. Starch and firmness were significantly positively correlated with shelf life (p < 0.001). In contrast, weight loss, color value (a*, b*, △E, and C*), and storage temperature showed significant negative correlation with shelf life (p < 0.001). Therefore, these quality attributes were regarded as the result of dimensionality reduction after CA and could be used as an input layer of BP ANN (D3) to predict the shelf life of ‘Royal Gala’.
BP ANN Model
ANN is a machine learning tool that can simulate complex and non-linear systems due to its ability to use learning algorithms and establish the relationship between input and output variables (Zobel and Cook, 2011). The correlation coefficient of the predicted versus measured shelf life is shown in Fig. 3, while the relative error, RMS and mean relative error of measured versus predicted shelf life are presented in Table 2 and Table 3, respectively. When all measured indicators (D1) are used as input, the R2, average relative error, and RMS values are 0.996 (p < 0.001), 0.071, and 0.088, respectively. However, when the non-zero indicators obtained from SPCA (D2) are used as the BP ANN input, the R2, average relative error, and RMS values of measured versus predicted shelf life are 0.997 (p < 0.001), 0.074, and 0.092, respectively. When the CA indicators (D3) were used as input, the R2, average relative error, and RMS were 0.993 (p < 0.001), 0.074, and 0.112, respectively. The results above show the accuracy of BP ANN in predicting the shelf life of ‘Royal Gala’ apples. The quality attribute identified by the CA was color value, while SPCA identified physical and chemical indicators. Weight loss, starch, △E, and storage temperature values were obtained by two different dimensionality reduction methods. Storage temperature is an important environmental variable that affects postharvest storage time (Abdelfattah et al., 2020). Maintaining fruits at low temperatures is the most common postharvest storage method for apples. When D1, D2, and D3 were used as the input layers of BP ANN, the number of input layer neurons were 12, 8, and 6, respectively. Thus, increasing the number of input layer neurons did not cause significant differences in accuracy. These findings could be attributed to the fact that for a specified dataset, only a few of the selected variables have the information necessary to support the construction of an effective prediction model (Pan et al., 2016). Accurate values for all variables were only attained when the six variables obtained by SPCA were used as the BP ANN input layer. Therefore, SPCA BP ANN is effective for constructing a shelf life prediction model of ‘Royal Gala’ apples, and SPCA is feasible for use selecting feature variables.
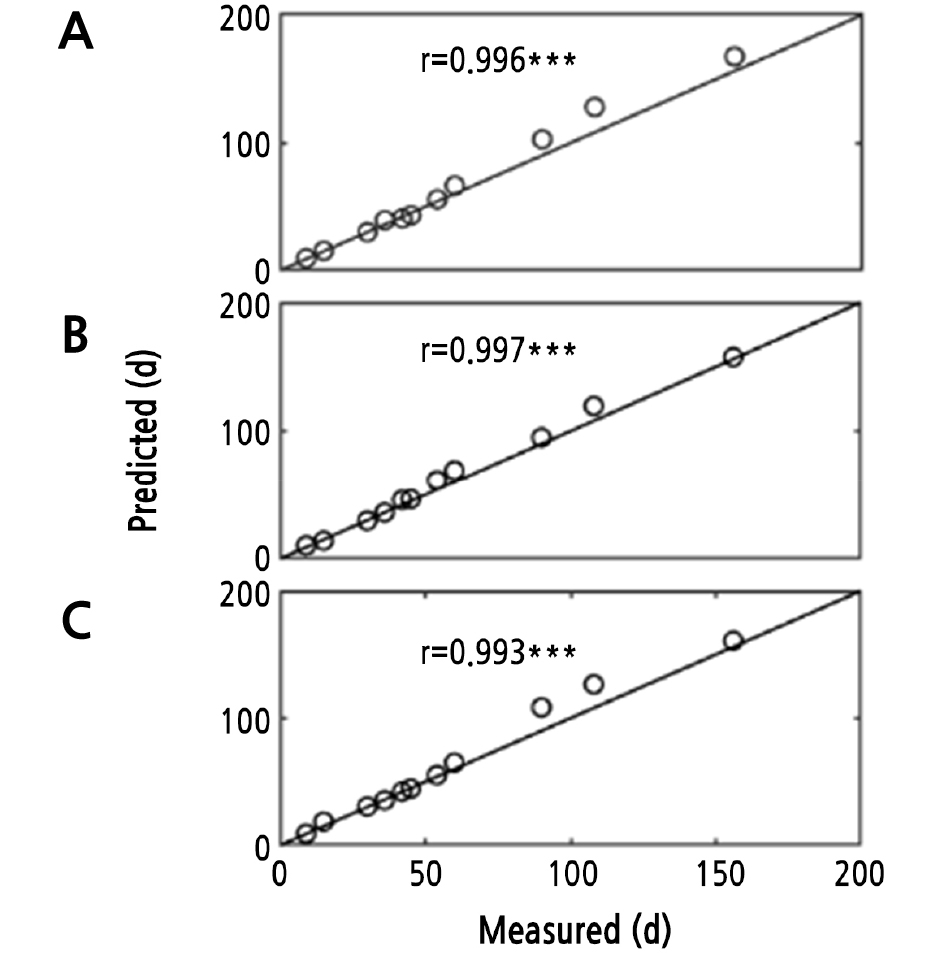
Fig. 3.
The correlation between measured and predicted shelf life. Measured represents measured shelf life, Predicted represents predicted shelf life, r represents correlation coefficient, *** significant at 0.1% level of significance, ** significant at 5% level of significance, * significant at 1% level of significance, A, B, and C represent the input layer of BP ANN is D1 temperature, color value (L*, a*, b*, △E, and C*), weight loss, firmness, titratable acidity, soluble solids content, starch, and reducing ascorbic acid); D2 the key quality attributes were screened by sparse principal component analysis (SPCA) and D3 correlation analysis (CA).
Table 2.
Validation set results of predicted shelf life and relative error with different input dataset of BP ANN. Measured represents measured shelf life, the unit is day, predicted represents the predicted shelf life, and RE represents the relative error. D1, D2, and D3 represent the input layer of BP ANN is D1. Temperature, color value (L*, a*, b*, △E, and C*), weight loss, firmness, titratable acidity, soluble solids content, starch, and reducing ascorbic acid; D2 the key qualityattributes were screened by sparse principal component analysis (SPCA) and D3 correlation analysis (CA)
Table 3.
Validation set results of mean relative error and RMS with a different input dataset of BP ANN. Measured represents measured shelf life, the unit is day, predicted represents the predicted shelf life, and RE represents the relative error. D1, D2, and D3 represent the input layer of BP ANN is temperature, color value (L*, a*, b*, △E, and C*), weight loss, firmness, titratable acidity, soluble solids content, starch, and reducing ascorbic acid (D1); the key qualityattributes were screened by sparse principal component analysis (SPCA) (D2) and correlation analysis (CA) (D3)
| All indicators (D1) | SPCA (D2) | Correlation analysis (D3) | |
| Mean relative error | 0.071 | 0.074 | 0.074 |
| RMS | 0.088 | 0.092 | 0.112 |
In summary, three datasets, D1, D2, and D3, were used as the BP ANN input layer. We have shown that all three sets acquired accurate shelf life prediction results. The BP ANN algorithm has been proven powerful in determining the correlation between the shelf life and quality attributes and storage temperature. Previous research also showed that the BP ANN model is superior to multiple linear regression in determining the relationship between the input and output layers (Meng et al., 2012; Li et al., 2014; Chen et al., 2019), mainly due to the complexity of the internal structure of BP ANN (Zobel and Cook, 2011). CA and SPCA reduced the number of feature quality attributes from 12 to 8 and 6, respectively, indicating that SPCA is useful for feature selection of small-scale datasets. Furthermore, the combination of SPCA-BP ANN showed the best performance among the three groups with respect to the lower relative error and RMS. Weight loss, starch, △E value, reducing ascorbic acid levels, SSC, and the storage temperature obtained from SPCA were selected as the key indicators for the input layer of BP ANN to predict the shelf life of ‘Royal Gala’ apple. Quality attributes in the storage environment should be measured as far as possible to avoid the impact of environmental changes on apples. The potential for using quality attributes to predict shelf life has been researched on several agricultural products, and models for shelf life prediction have been built mostly based on Weibull (Li et al., 2017) and Arrhenius equations (Shi et al., 2016). Since the change rate of apple quality attributes shows a complicated trend with increasing temperature, the accuracy of predicted shelf life using the Arrhenius equation is poor (Shi et al., 2016). Therefore, the model devised in this study provides a new effective method for estimating the shelf life of ‘Royal Gala’ apples.
Using the ANN algorithm for shelf life prediction of apples is expected to be more rapid and convenient than the previous methods. The parameters of the BP ANN model constructed by D2 are shown in the supplementary file. We obtained the shelf life from the corresponding quality attribute values and parameters. The parameters can also be used for software development to determine postharvest apple shelf life more conveniently and quickly. Accurate shelf life prediction helps determine the deadline for the marketing of stored apples to avoid postharvest loss, which is a common concern for consumers, producers, and managers. Successful implementation of this research will provide an alternative method for shelf life determination of horticultural crops. This method is not limited to the apple cultivar used in this study. Further, this approach can be applied industrially on fresh crops and other plant materials for shelf life prediction.
